- Page 1 and 2: ForewordThe states and some countie
- Page 3 and 4: Table of ContentsSECTIONFOREWORDTAB
- Page 5 and 6: List of Figures and TablesNumber Ti
- Page 7 and 8: State IndexAlabamaAlaskaArizonaArka
- Page 9 and 10: Executive SummaryParticipants. Alth
- Page 11 and 12: Executive Summarypounds. States wan
- Page 14 and 15: Section 1 IntroductionFor the past
- Page 16: The Clean Sweep Reportshort-term or
- Page 19 and 20: Section 1 Introductionextensive and
- Page 21 and 22: Section 1 Introductionfunded, conti
- Page 23 and 24: Section 2 Clean Sweep Program Opera
- Page 25 and 26: Section 2Clean Sweep Program Operat
- Page 27 and 28: Section 2 Clean Sweep Program Opera
- Page 29 and 30: Section 2 Clean Sweep Program Opera
- Page 31 and 32: Section 2 Clean Sweep Program Opera
- Page 33 and 34: Section 2 Clean Sweep Program Opera
- Page 35 and 36: Section 2Clean Sweep Program Operat
- Page 37 and 38: Section 2 Clean Sweep Program Opera
- Page 39 and 40: Section 2 Clean Sweep Program Opera
- Page 41 and 42: Section 2 Clean Sweep Program Opera
- Page 43 and 44: Section 2 Clean Sweep Program Opera
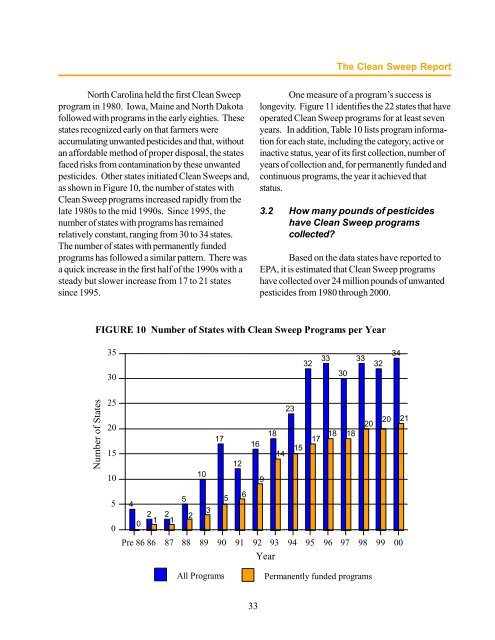
- Page 45: Section 3 Clean Sweep Program Resul
- Page 49 and 50: Section 3 Clean Sweep Program Resul
- Page 51 and 52: Table 11 Total Amount of Pesticides
- Page 53 and 54: Section 3 Clean Sweep Program Resul
- Page 55 and 56: Section 3 Clean Sweep Program Resul
- Page 57 and 58: 44Table 13 Specific Pesticides Trac
- Page 59 and 60: Table 14 Quantity of the Most Commo
- Page 61 and 62: Section 4 Challenges and Opportunit
- Page 63 and 64: Section 4 Challenges and Opportunit
- Page 65 and 66: Section 4 Challenges and Opportunit
- Page 67 and 68: Section 4 Challenges and Opportunit
- Page 69 and 70: Section 4 Challenges and Opportunit
- Page 71 and 72: Section 5 Observations5.2 The unit
- Page 73 and 74: Section 5ObservationsTable 17: Tota
- Page 75 and 76: Section 5 Observations5.3 Reliable
- Page 77 and 78: Section 5 Observationsamount annual
- Page 79 and 80: Appendix INOTES on STATE “ATA GLA
- Page 81 and 82: ALABAMA AT A GLANCESince 1994 Alaba
- Page 83 and 84: ALASKA AT A GLANCEAlaska conducts s
- Page 85 and 86: ARIZONA AT A GLANCEArizona does not
- Page 87 and 88: ARKANSAS AT A GLANCEThe Arkansas St
- Page 89 and 90: CALIFORNIA AT A GLANCESince 1989 Ca
- Page 91 and 92: COLORADO AT A GLANCEAn EPA grant an
- Page 93 and 94: YearColorado Table 1 - Quantity of
- Page 95 and 96: Summary of Connecticut Waste Pestic
- Page 97 and 98:
Summary of Delaware Waste Pesticide
- Page 99 and 100:
Summary of Florida Waste Pesticide
- Page 101 and 102:
GEORGIA AT A GLANCEGeorgia has cond
- Page 103 and 104:
HAWAII AT A GLANCEHawaii conducted
- Page 105 and 106:
IDAHO AT A GLANCEIdaho’s permanen
- Page 107 and 108:
ILLINOIS AT A GLANCESince its first
- Page 109 and 110:
Illinois attempted a swap program i
- Page 111 and 112:
Summary of Indiana Waste Pesticide
- Page 113 and 114:
IOWA AT A GLANCESince 1991 Iowa has
- Page 115 and 116:
YearIowa Table 1 - Quantity of Pest
- Page 117 and 118:
Summary of Kansas Waste Pesticide D
- Page 119 and 120:
KENTUCKY AT A GLANCEKentucky conduc
- Page 121 and 122:
LOUISIANA AT A GLANCELouisiana coll
- Page 123 and 124:
MAINE AT A GLANCEMaine conducted it
- Page 125 and 126:
MARYLAND AT A GLANCEThe Maryland De
- Page 127 and 128:
MASSACHUSETTS AT A GLANCEMassachuse
- Page 129 and 130:
MICHIGAN AT A GLANCEMichigan’s pe
- Page 131 and 132:
MINNESOTA AT A GLANCESince 1989 Min
- Page 133 and 134:
Minnesota Table 1 - Quantity of Pes
- Page 135 and 136:
Summary of Mississippi Waste Pestic
- Page 137 and 138:
Summary of Missouri Waste Pesticide
- Page 139 and 140:
Summary of Montana Waste Pesticide
- Page 141 and 142:
Summary of Nebraska Waste Pesticide
- Page 143 and 144:
Summary of Nevada Waste Pesticide D
- Page 145 and 146:
Summary of New Hampshire Waste Pest
- Page 147 and 148:
Summary of New Jersey Waste Pestici
- Page 149 and 150:
New Jersey Table 3 - County-by-Coun
- Page 151 and 152:
Summary of New Mexico Waste Pestici
- Page 153 and 154:
Summary of New York Waste Pesticide
- Page 155 and 156:
churches, schools and businesses. P
- Page 157 and 158:
NORTH CAROLINA AT A GLANCENorth Car
- Page 159 and 160:
North Carolina Table 1 - Quantity o
- Page 161 and 162:
Summary of North Dakota Waste Pesti
- Page 163 and 164:
Summary of Ohio Waste Pesticide Dis
- Page 165 and 166:
OKLAHOMA AT A GLANCEOklahoma does n
- Page 167 and 168:
OREGON AT A GLANCESince 1991 Oregon
- Page 169 and 170:
PENNSYLVANIA AT A GLANCEIn 1993 Pen
- Page 171 and 172:
RHODE ISLAND AT A GLANCERhode Islan
- Page 173 and 174:
SOUTH CAROLINA AT A GLANCESouth Car
- Page 175 and 176:
SOUTH DAKOTA AT A GLANCESince 1993
- Page 177 and 178:
TENNESSEE AT A GLANCEThe Tennessee
- Page 179 and 180:
TEXAS AT A GLANCESince 1992 Texas h
- Page 181 and 182:
YearNumberof SitesTexas Table 1 - Q
- Page 183 and 184:
UTAH AT A GLANCESince 1993 Utah has
- Page 185 and 186:
VERMONT AT A GLANCEVermont first co
- Page 187 and 188:
VIRGINIA AT A GLANCEVirginia conduc
- Page 189 and 190:
YearQuantity ofPesticides(pounds)Vi
- Page 191 and 192:
Summary of Washington Waste Pestici
- Page 193 and 194:
Summary of West Virginia Waste Pest
- Page 195 and 196:
Summary of Wisconsin Waste Pesticid
- Page 197 and 198:
WYOMING AT A GLANCEIn 1992 Wyoming
- Page 199 and 200:
Appendix II - Pesticides That are R
- Page 201 and 202:
Appendix IIU044 chloroform U080 met
- Page 203 and 204:
Appendix IIIB. Availability Contrac
- Page 205 and 206:
Appendix III4. Federal Hazardous Ma
- Page 207 and 208:
Appendix III22. INDEPENDENT CONTRAC
- Page 209 and 210:
Appendix IIIContractor further agre
- Page 211 and 212:
Appendix III33. CONTRACTOR’S DUTI
- Page 213 and 214:
Appendix IIIC. Any deviation of mor
- Page 215 and 216:
Appendix III45. MERGER CLAUSEThis a
- Page 217 and 218:
Appendix IVOnyx Environmental Servi
- Page 219 and 220:
State Pre-89 1989 1990 1991 1992 19
- Page 221 and 222:
State pre-89 1989 1990 1991 1992 19
- Page 223 and 224:
Appendix VILouisiana: Division of P
- Page 225 and 226:
Appendix VII - Sample Emergency Pla
- Page 227 and 228:
Appendix VIIICOMPARISON OF PESTICID
- Page 229:
StateEstimated(lbs. A.I.)Total Used