Fremantle Port Inner Harbour and Channel ... - Fremantle Ports
Fremantle Port Inner Harbour and Channel ... - Fremantle Ports
Fremantle Port Inner Harbour and Channel ... - Fremantle Ports
- No tags were found...

You also want an ePaper? Increase the reach of your titles
YUMPU automatically turns print PDFs into web optimized ePapers that Google loves.
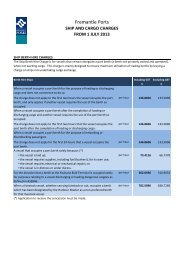
Figure 1.1Figure 1.2Figure 1.3Figure 1.4Figure 2.1Figure 2.2Figure 3.1Figure 3.2Figure 3.3Figure 3.4Figure 3.5Figure 3.6Figure 3.7List of FiguresGage Roads Offshore Disposal Area <strong>and</strong> <strong>Fremantle</strong> <strong>Port</strong> Authority mooringareas ........................................................................................................................ 2Gage Roads habitat map in 2009, prior to disposal ................................................. 3Bathymetry for Gage Roads Offshore Disposal Area prior to sedimentdisposal from the <strong>Inner</strong> <strong>Harbour</strong> Deepening Project ................................................ 5Benthic habitat within Gage Roads 2011 ................................................................. 7Towed video ground truthing transects .................................................................. 10Permanent seagrass <strong>and</strong> sediment survey sites, Gage Roads ............................. 12Gage Roads Offshore Disposal Area <strong>and</strong> surrounds post disposal benthichabitat map 2011 ................................................................................................... 20Benthic habitat post disposal within Gage Roads, December 2011 ...................... 21Changes in benthic habitat within Gage Roads between December 2009 <strong>and</strong>December 2011 ..................................................................................................... 22Baseline mean seagrass shoot counts .................................................................. 23Percentage cover by benthic categories ................................................................ 24Particle size distributions ....................................................................................... 26Differences in bathymetry from pre- to post-disposal (November 2009 toDecember 2010) within <strong>and</strong> surrounding the Offshore Disposal Area ................... 28Figure 3.8 Depths of disposal area after deposition of dredged material inDecember 2010 ..................................................................................................... 29Figure 3.9 Differences in bathymetry from post disposal December 2010 toDecember 2011 ..................................................................................................... 30Figure 3.10Depths of Offshore Disposal area after deposition of dredged materials inDecember 2011 ..................................................................................................... 31List of TablesTable 1.1Table 2.1Table 2.2Table 2.3Table 3.1Table 3.2Table 3.3Table 3.4Table 3.5Table 3.6Table 3.7Seagrass shoot count data from monitoring sites established for the <strong>Inner</strong><strong>Harbour</strong> <strong>and</strong> <strong>Channel</strong> Deepening Project ................................................................ 8Seagrass sites, zone designation <strong>and</strong> distance to Offshore Disposal Areaboundary ................................................................................................................ 13Substrate categories used for estimates of seagrass percentage cover ............... 14Limits of Reporting (LOR) <strong>and</strong> Interim sediment quality guidelines (ISQG) fornutrients <strong>and</strong> metals .............................................................................................. 15Seagrass habitat loss with the Offshore Disposal Area, Zone of Potentialloss <strong>and</strong> Potential Effect ........................................................................................ 19PERMANOVA table of results for P.angustifolia shoot counts .............................. 24Pairwise post hoc tests for P.angustifolia shoot counts ......................................... 24PERMANOVA table of results for P.angustifolia percentage cover ....................... 25Pairwise post hoc tests for P.angustifolia percentage cover ................................. 25Correlation between whole sediment nutrients <strong>and</strong> metals vs P. angustifoliavariables or percentage cover ............................................................................... 26Data ranges <strong>and</strong> detection limits of sediment chemical parameters ..................... 27List of AppendicesAppendix A Geo Oceans ReportAppendix B GeoImage ReportAppendix C Seagrass Monitoring Site DiagramsAppendix D Chain of Custody FormsAppendix E Seagrass Shoot Count Data SheetsAppendix F Percentage CoverAppendix G Sediment Field LogAppendix H Particle Size DistributionsAppendix I Nutrient <strong>and</strong> Metals DataAppendix J Pore-water Nutrients, Whole Sediment Nutrient <strong>and</strong> Metals GraphsiiOceanica: <strong>Fremantle</strong> <strong>Port</strong>s: FP – Gage Roads Offshore Disposal Area Seagrass Recovery Project, Phase I – Initial Survey