
You also want an ePaper? Increase the reach of your titles
YUMPU automatically turns print PDFs into web optimized ePapers that Google loves.
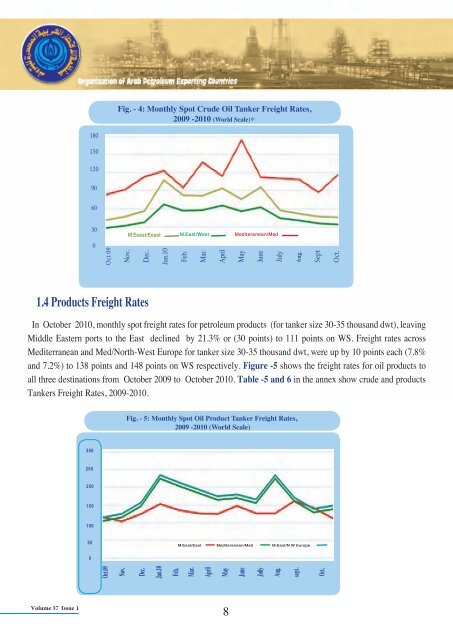
Fig. - 4: Monthly Spot Crude Oil Tanker Freight Rates,2009 -2010 (World Scale)*1801501209060300Oct.09M.Eeast/Eeast M.East/West Mediteranean/MedNov.Dec.Jan.10Feb.Mar.AprilMayJuneJulyAug..SeptOct.1.4 Products Freight RatesIn October 2010, monthly spot freight rates for petroleum products (for tanker size 30-35 thousand dwt), leavingMiddle Eastern ports to the East declined by 21.3% or (30 points) to 111 points on WS. Freight rates acrossMediterranean and Med/North-West Europe for tanker size 30-35 thousand dwt, were up by 10 points each (7.8%and 7.2%) to 138 points and 148 points on WS respectively. Figure -5 shows the freight rates for oil products toall three destinations from October 2009 to October 2010. Table -5 and 6 in the annex show crude and productsTankers Freight Rates, 2009-2010.Fig. - 5: Monthly Spot Oil Product Tanker Freight Rates,2009 -2010 (World Scale)٣٠٠٢٥٠٢٠٠١٥٠١٠٠٥٠M.East/East Mediteranean/Med M.East/N.W Europe٠Oct.09Nov.Dec.Jan.10Feb.Mar.AprilMayJuneJullyAug.sept.Oct.Volume 37 Issue 18