
Create successful ePaper yourself
Turn your PDF publications into a flip-book with our unique Google optimized e-Paper software.
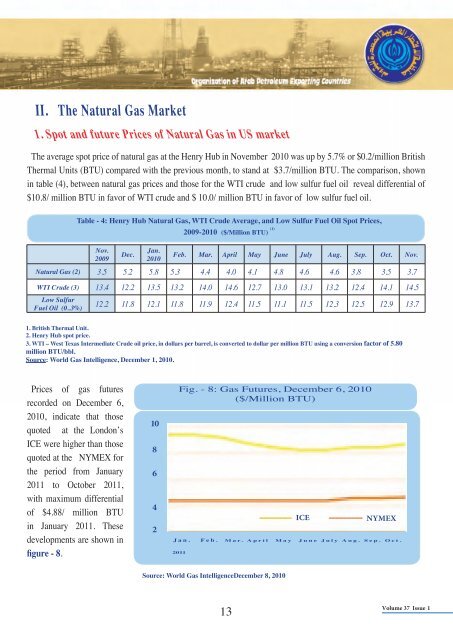
II. The Natural Gas Market1. Spot and future Prices of Natural Gas in US marketThe average spot price of natural gas at the Henry Hub in November 2010 was up by 5.7% or $0.2/million BritishThermal Units (BTU) compared with the previous month, to stand at $3.7/million BTU. The comparison, shownin table (4), between natural gas prices and those for the WTI crude and low sulfur fuel oil reveal differential of$10.8/ million BTU in favor of WTI crude and $ 10.0/ million BTU in favor of low sulfur fuel oil.Table - 4: Henry Hub Natural Gas, WTI Crude Average, and Low Sulfur Fuel Oil Spot Prices,2009-2010 ($/Million BTU) (1)Nov.2009Dec.Jan.2010Feb. Mar. April May June July Aug. Sep. Oct. Nov..Natural Gas (2) 3.5 5.2 5.8 5.3 4.4 4.0 4.1 4.8 4.6 4.6 3.8 3.5 3.7WTI Crude (3) 13.4 12.2 13.5 13.2 14.0 14.6 12.7 13.0 13.1 13.2 12.4 14.1 14.5Low SulfurFuel Oil (0..3%)12.2 11.8 12.1 11.8 11.9 12.4 11.5 11.1 11.5 12.3 12.5 12.9 13.71. British Thermal Unit.2. Henry Hub spot price.3. WTI – West Texas Intermediate Crude oil price, in dollars per barrel, is converted to dollar per million BTU using a conversion factor of 5.80million BTU/bbl.Source: World Gas Intelligence, December 1, 2010.Prices of gas futuresrecorded on December 6,2010, indicate that thosequoted at the London’sICE were higher than thosequoted at the NYMEX forthe period from January2011 to October 2011,with maximum differentialof $4.88/ million BTUin January 2011. Thesedevelopments are shown infigure - 8.108642Fig. - 8: Gas Futures, December 6, 2010($/Million BTU)Jan.2011NYMEX ICE Feb. Mar. April May June July Aug. Sep. Oct.Source: World Gas IntelligenceDecember 8, 201013Volume 37 Issue 1