
You also want an ePaper? Increase the reach of your titles
YUMPU automatically turns print PDFs into web optimized ePapers that Google loves.
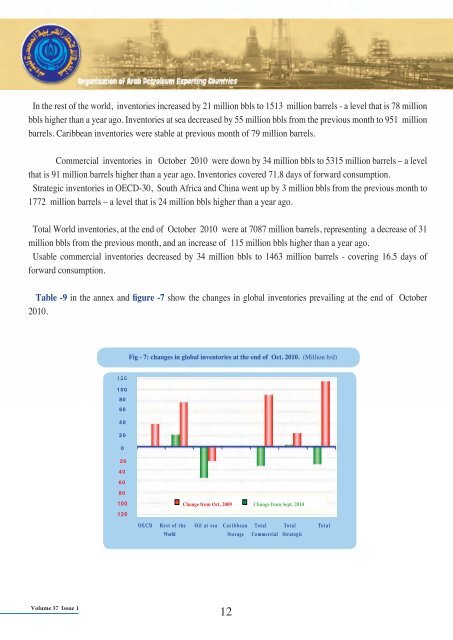
In the rest of the world, inventories increased by 21 million bbls to 1513 million barrels - a level that is 78 millionbbls higher than a year ago. Inventories at sea decreased by 55 million bbls from the previous month to 951 millionbarrels. Caribbean inventories were stable at previous month of 79 million barrels.Commercial inventories in October 2010 were down by 34 million bbls to 5315 million barrels – a levelthat is 91 million barrels higher than a year ago. Inventories covered 71.8 days of forward consumption.Strategic inventories in OECD-30, South Africa and China went up by 3 million bbls from the previous month to1772 million barrels – a level that is 24 million bbls higher than a year ago.Total World inventories, at the end of October 2010 were at 7087 million barrels, representing a decrease of 31million bbls from the previous month, and an increase of 115 million bbls higher than a year ago.Usable commercial inventories decreased by 34 million bbls to 1463 million barrels - covering 16.5 days offorward consumption.Table -9 in the annex and figure -7 show the changes in global inventories prevailing at the end of October2010.Fig - 7: changes in global inventories at the end of Oct. 2010. (Million b/d)١٢٠١٠٠٨٠٦٠٤٠٢٠٠٢٠٤٠٦٠٨٠١٠٠١٢٠Change from Oct. 2009 Change from Sept. 2010OECD Rest of the Oil at sea Caribbean Total Total TotalWorld Storage Commercial StrategicVolume 37 Issue 112