- Page 2:
Principles and Practice of Geriatri
- Page 6:
Copyright # 2002 John Wiley & Sons,
- Page 10:
viCONTENTS20 Long-term Outcome Stud
- Page 14:
viiiCONTENTSEIX Conditions Associat
- Page 20:
Principles and Practice of Geriatri
- Page 24:
CONTRIBUTORSxiiiA. F. Fairburn Cons
- Page 28:
CONTRIBUTORSxvI. R. Katz Section of
- Page 32:
CONTRIBUTORSxviiM. Philpot Departme
- Page 36:
Principles and Practice of Geriatri
- Page 40:
Principles and Practice of Geriatri
- Page 44:
INDEX 803community care continuedin
- Page 48:
INDEX 805erectile failure 635EURO-D
- Page 52:
INDEX 807neurofibrillary tangles (N
- Page 56:
INDEX 809social support 96-7, 546de
- Page 60:
Principles and Practice of Geriatri
- Page 64:
HISTORICAL BACKGROUND 5forces also
- Page 68:
Principles and Practice of Geriatri
- Page 72:
Principles and Practice of Geriatri
- Page 76:
THE DEVELOPMENT IN BRITAIN 11REFERE
- Page 80:
14 PRINCIPLES AND PRACTICE OF GERIA
- Page 84:
16 PRINCIPLES AND PRACTICE OF GERIA
- Page 88:
Principles and Practice of Geriatri
- Page 92:
GENERAL THEORIES OF AGING 21seems t
- Page 96:
Principles and Practice of Geriatri
- Page 100:
Principles and Practice of Geriatri
- Page 104:
ANATOMY OF THE AGING BRAIN 27Table
- Page 108:
ANATOMY OF THE AGING BRAIN 29Table
- Page 112:
ANATOMY OF THE AGING BRAIN 31Table
- Page 116:
ANATOMY OF THE AGING BRAIN 33Table
- Page 120:
ANATOMY OF THE AGING BRAIN 35Table
- Page 124:
ANATOMY OF THE AGING BRAIN 37Table
- Page 128:
ANATOMY OF THE AGING BRAIN 39Table
- Page 132:
ANATOMY OF THE AGING BRAIN 41quanti
- Page 136:
ANATOMY OF THE AGING BRAIN 4396. He
- Page 140:
46 PRINCIPLES AND PRACTICE OF GERIA
- Page 144:
48 PRINCIPLES AND PRACTICE OF GERIA
- Page 148:
50 PRINCIPLES AND PRACTICE OF GERIA
- Page 152:
52 PRINCIPLES AND PRACTICE OF GERIA
- Page 156:
54 PRINCIPLES AND PRACTICE OF GERIA
- Page 160:
Principles and Practice of Geriatri
- Page 164:
NEUROPHYSIOLOGY OF AGEING 59‘‘e
- Page 168:
Principles and Practice of Geriatri
- Page 172:
PHARMACOKINETIC AND PHARMACODYNAMIC
- Page 176:
Principles and Practice of Geriatri
- Page 180:
NORMAL AGEING—A PROBLEMATICAL CON
- Page 184:
68 PRINCIPLES AND PRACTICE OF GERIA
- Page 188:
Principles and Practice of Geriatri
- Page 192:
CHRONOLOGICAL AND FUNCTIONAL AGEING
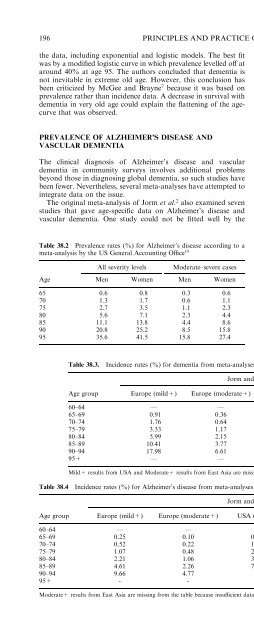
- Page 196:
Principles and Practice of Geriatri
- Page 200:
76 PRINCIPLES AND PRACTICE OF GERIA
- Page 204:
Principles and Practice of Geriatri
- Page 208:
THE NORMAL AGED AMONG COMMUNITY-DWE
- Page 212:
Principles and Practice of Geriatri
- Page 216:
THE NORMAL AGED AMONG COMMUNITY-DWE
- Page 220:
88 PRINCIPLES AND PRACTICE OF GERIA
- Page 224:
Principles and Practice of Geriatri
- Page 228:
Principles and Practice of Geriatri
- Page 232:
96 PRINCIPLES AND PRACTICE OF GERIA
- Page 236:
98 PRINCIPLES AND PRACTICE OF GERIA
- Page 240:
100 PRINCIPLES AND PRACTICE OF GERI
- Page 244:
102 PRINCIPLES AND PRACTICE OF GERI
- Page 248:
104 PRINCIPLES AND PRACTICE OF GERI
- Page 252:
106 PRINCIPLES AND PRACTICE OF GERI
- Page 256:
108 PRINCIPLES AND PRACTICE OF GERI
- Page 260:
Principles and Practice of Geriatri
- Page 264:
114 PRINCIPLES AND PRACTICE OF GERI
- Page 268:
Principles and Practice of Geriatri
- Page 272:
PSYCHIATRIC DIAGNOSIS AND OLD AGE 1
- Page 276:
PSYCHIATRIC DIAGNOSIS AND OLD AGE 1
- Page 280:
124 PRINCIPLES AND PRACTICE OF GERI
- Page 284:
126 PRINCIPLES AND PRACTICE OF GERI
- Page 288:
128 PRINCIPLES AND PRACTICE OF GERI
- Page 292:
130 PRINCIPLES AND PRACTICE OF GERI
- Page 296:
132 PRINCIPLES AND PRACTICE OF GERI
- Page 300:
134 PRINCIPLES AND PRACTICE OF GERI
- Page 304:
136 PRINCIPLES AND PRACTICE OF GERI
- Page 308:
138 PRINCIPLES AND PRACTICE OF GERI
- Page 312:
140 PRINCIPLES AND PRACTICE OF GERI
- Page 316:
NON-COMPUTERIZED ASSESSMENT PROCEDU
- Page 320:
142 PRINCIPLES AND PRACTICE OF GERI
- Page 324:
NON-COMPUTERIZED ASSESSMENT PROCEDU
- Page 328:
NON-COMPUTERIZED ASSESSMENT PROCEDU
- Page 332:
Principles and Practice of Geriatri
- Page 336:
COMPUTER METHODS OF ASSESSMENT OF C
- Page 340:
COMPUTER METHODS OF ASSESSMENT OF C
- Page 344:
154 PRINCIPLES AND PRACTICE OF GERI
- Page 348:
156 PRINCIPLES AND PRACTICE OF GERI
- Page 352:
Principles and Practice of Geriatri
- Page 356:
160 PRINCIPLES AND PRACTICE OF GERI
- Page 360:
162 PRINCIPLES AND PRACTICE OF GERI
- Page 364:
INTERVIEWS AIMED AT DIFFERENTIAL PS
- Page 368:
166 PRINCIPLES AND PRACTICE OF GERI
- Page 372: Principles and Practice of Geriatri
- Page 376: RATING SCALES DESIGNED FOR NURSES A
- Page 380: Principles and Practice of Geriatri
- Page 384: 176 PRINCIPLES AND PRACTICE OF GERI
- Page 388: Principles and Practice of Geriatri
- Page 392: DELIRIUM—AN OVERVIEW 181Table 35.
- Page 396: Principles and Practice of Geriatri
- Page 400: Principles and Practice of Geriatri
- Page 404: NOSOLOGY OF DEMENTIA 187by embolic
- Page 408: NOSOLOGY OF DEMENTIA 1898. Blennow
- Page 412: 190 PRINCIPLES AND PRACTICE OF GERI
- Page 416: 192 PRINCIPLES AND PRACTICE OF GERI
- Page 420: Principles and Practice of Geriatri
- Page 426: Principles and Practice of Geriatri
- Page 430: Principles and Practice of Geriatri
- Page 434: Principles and Practice of Geriatri
- Page 438: 204 PRINCIPLES AND PRACTICE OF GERI
- Page 442: 206 PRINCIPLES AND PRACTICE OF GERI
- Page 446: 208 PRINCIPLES AND PRACTICE OF GERI
- Page 450: THE EPIDEMIOLOGY OF ALZHEIMER’S D
- Page 454: THE EPIDEMIOLOGY OF ALZHEIMER’S D
- Page 458: 214 PRINCIPLES AND PRACTICE OF GERI
- Page 462: 216 PRINCIPLES AND PRACTICE OF GERI
- Page 466: Principles and Practice of Geriatri
- Page 470: Principles and Practice of Geriatri
- Page 474:
Principles and Practice of Geriatri
- Page 478:
THE GENETICS OF ALZHEIMER’S DISEA
- Page 482:
222 PRINCIPLES AND PRACTICE OF GERI
- Page 486:
224 PRINCIPLES AND PRACTICE OF GERI
- Page 490:
226 PRINCIPLES AND PRACTICE OF GERI
- Page 494:
Principles and Practice of Geriatri
- Page 498:
230 PRINCIPLES AND PRACTICE OF GERI
- Page 502:
232 PRINCIPLES AND PRACTICE OF GERI
- Page 506:
234 PRINCIPLES AND PRACTICE OF GERI
- Page 510:
236 PRINCIPLES AND PRACTICE OF GERI
- Page 514:
238 PRINCIPLES AND PRACTICE OF GERI
- Page 518:
240 PRINCIPLES AND PRACTICE OF GERI
- Page 522:
242 PRINCIPLES AND PRACTICE OF GERI
- Page 526:
244 PRINCIPLES AND PRACTICE OF GERI
- Page 530:
Principles and Practice of Geriatri
- Page 534:
Principles and Practice of Geriatri
- Page 538:
252 PRINCIPLES AND PRACTICE OF GERI
- Page 542:
254 PRINCIPLES AND PRACTICE OF GERI
- Page 546:
Principles and Practice of Geriatri
- Page 550:
Principles and Practice of Geriatri
- Page 554:
Principles and Practice of Geriatri
- Page 558:
NEUROPATHOLOGY: OTHER DEMENTIAS 261
- Page 562:
NEUROPATHOLOGY: OTHER DEMENTIAS 263
- Page 566:
266 PRINCIPLES AND PRACTICE GERIATR
- Page 570:
Principles and Practice of Geriatri
- Page 574:
270 PRINCIPLES AND PRACTICE OF GERI
- Page 578:
Principles and Practice of Geriatri
- Page 582:
EARLY-ONSET DEMENTIAS 275(a) Sleep
- Page 586:
278 PRINCIPLES AND PRACTICE OF GERI
- Page 590:
280 PRINCIPLES AND PRACTICE OF GERI
- Page 594:
282 PRINCIPLES AND PRACTICE OF GERI
- Page 598:
Principles and Practice of Geriatri
- Page 602:
TOXIC DEMENTIAS 28711. Harper CG, G
- Page 606:
290 PRINCIPLES AND PRACTICE OF GERI
- Page 610:
292 PRINCIPLES AND PRACTICE OF GERI
- Page 614:
294 PRINCIPLES AND PRACTICE OF GERI
- Page 618:
296 PRINCIPLES AND PRACTICE OF GERI
- Page 622:
298 PRINCIPLES AND PRACTICE OF GERI
- Page 626:
300 PRINCIPLES AND PRACTICE OF GERI
- Page 630:
302 PRINCIPLES AND PRACTICE OF GERI
- Page 634:
304 PRINCIPLES AND PRACTICE OF GERI
- Page 638:
306 PRINCIPLES AND PRACTICE OF GERI
- Page 642:
Principles and Practice of Geriatri
- Page 646:
310 PRINCIPLES AND PRACTICE OF GERI
- Page 650:
312 PRINCIPLES AND PRACTICE OF GERI
- Page 654:
314 PRINCIPLES AND PRACTICE OF GERI
- Page 658:
316 PRINCIPLES AND PRACTICE OF GERI
- Page 662:
318 PRINCIPLES AND PRACTICE OF GERI
- Page 666:
320 PRINCIPLES AND PRACTICE OF GERI
- Page 670:
322 PRINCIPLES AND PRACTICE OF GERI
- Page 674:
Principles and Practice of Geriatri
- Page 678:
Principles and Practice of Geriatri
- Page 682:
PSYCHOLOGICAL AND PSYCHOSOCIAL INTE
- Page 686:
332 PRINCIPLES AND PRACTICE OF GERI
- Page 690:
Principles and Practice of Geriatri
- Page 694:
336 PRINCIPLES AND PRACTICE OF GERI
- Page 698:
338 PRINCIPLES AND PRACTICE OF GERI
- Page 702:
Principles and Practice of Geriatri
- Page 706:
PERIPHERAL NEUROPATHY 343Table 61.3
- Page 710:
Principles and Practice of Geriatri
- Page 714:
EEG 347the EEG predicts survival ti
- Page 718:
EEG 3496. Busse EW. Electroencephal
- Page 722:
352Table 63.1 Clinical and structur
- Page 726:
354 PRINCIPLES AND PRACTICE OF GERI
- Page 730:
356 PRINCIPLES AND PRACTICE OF GERI
- Page 734:
Principles and Practice of Geriatri
- Page 738:
PET 361to control subjects, suggest
- Page 742:
Principles and Practice of Geriatri
- Page 746:
SINGLE-PHOTON EMISSION COMPUTERIZED
- Page 750:
SINGLE-PHOTON EMISSION COMPUTERIZED
- Page 754:
Principles and Practice of Geriatri
- Page 758:
372 PRINCIPLES AND PRACTICE OF GERI
- Page 762:
Principles and Practice of Geriatri
- Page 766:
GENETICS OF AFFECTIVE DISORDERS 377
- Page 770:
Principles and Practice of Geriatri
- Page 774:
Principles and Practice of Geriatri
- Page 778:
AETIOLOGY OF LATE-LIFE DEPRESSION 3
- Page 782:
AETIOLOGY OF LATE-LIFE DEPRESSION 3
- Page 786:
Principles and Practice of Geriatri
- Page 790:
Principles and Practice of Geriatri
- Page 794:
EPIDEMIOLOGY OF DEPRESSION 391Some
- Page 798:
Principles and Practice of Geriatri
- Page 802:
Principles and Practice of Geriatri
- Page 806:
EPIDEMIOLOGY OF DEPRESSION 3957. Ly
- Page 810:
398 PRINCIPLES AND PRACTICE OF GERI
- Page 814:
400 PRINCIPLES AND PRACTICE OF GERI
- Page 818:
Principles and Practice of Geriatri
- Page 822:
Principles and Practice of Geriatri
- Page 826:
Principles and Practice of Geriatri
- Page 830:
CLINICAL FEATURES OF DEPRESSION AND
- Page 834:
CLINICAL FEATURES OF DEPRESSION AND
- Page 838:
Principles and Practice of Geriatri
- Page 842:
CLINICAL FEATURES OF DEPRESSION AND
- Page 846:
Principles and Practice of Geriatri
- Page 850:
418 PRINCIPLES AND PRACTICE OF GERI
- Page 854:
420 PRINCIPLES AND PRACTICE OF GERI
- Page 858:
422 PRINCIPLES AND PRACTICE OF GERI
- Page 862:
Principles and Practice of Geriatri
- Page 866:
Principles and Practice of Geriatri
- Page 870:
Principles and Practice of Geriatri
- Page 874:
ACUTE MANAGEMENT OF LATE-LIFE DEPRE
- Page 878:
434 PRINCIPLES AND PRACTICE OF GERI
- Page 882:
436 PRINCIPLES AND PRACTICE OF GERI
- Page 886:
Principles and Practice of Geriatri
- Page 890:
PHARMACOLOGICAL TREATMENT OF DEPRES
- Page 894:
Principles and Practice of Geriatri
- Page 898:
Principles and Practice of Geriatri
- Page 902:
PSYCHOTHERAPY OF DEPRESSION AND DYS
- Page 906:
PSYCHOTHERAPY OF DEPRESSION AND DYS
- Page 910:
PSYCHOTHERAPY OF DEPRESSION AND DYS
- Page 914:
454 PRINCIPLES AND PRACTICE OF GERI
- Page 918:
456 PRINCIPLES AND PRACTICE OF GERI
- Page 922:
458 PRINCIPLES AND PRACTICE OF GERI
- Page 926:
Principles and Practice of Geriatri
- Page 930:
DEXAMETHASONE SUPPRESSION TEST 463m
- Page 934:
466 PRINCIPLES AND PRACTICE OF GERI
- Page 938:
Principles and Practice of Geriatri
- Page 942:
SUICIDAL BEHAVIOUR 471RecognitionDe
- Page 946:
Principles and Practice of Geriatri
- Page 950:
GENETICS AND AETIOLOGY 47537. Winok
- Page 954:
478 PRINCIPLES AND PRACTICE OF GERI
- Page 958:
480 PRINCIPLES AND PRACTICE OF GERI
- Page 962:
482 PRINCIPLES AND PRACTICE OF GERI
- Page 966:
484 PRINCIPLES AND PRACTICE OF GERI
- Page 970:
486 PRINCIPLES AND PRACTICE OF GERI
- Page 974:
488 PRINCIPLES AND PRACTICE OF GERI
- Page 978:
490 PRINCIPLES AND PRACTICE OF GERI
- Page 982:
Principles and Practice of Geriatri
- Page 986:
LATE-LIFE PSYCHOTIC DISORDERS 495Ta
- Page 990:
Principles and Practice of Geriatri
- Page 994:
CLINICAL ASSESSMENT AND DIFFERENTIA
- Page 998:
CLINICAL ASSESSMENT AND DIFFERENTIA
- Page 1002:
504 PRINCIPLES AND PRACTICE OF GERI
- Page 1006:
506 PRINCIPLES AND PRACTICE OF GERI
- Page 1010:
508 PRINCIPLES AND PRACTICE OF GERI
- Page 1014:
AETIOLOGY, GENETICS AND RISK FACTOR
- Page 1018:
512 PRINCIPLES AND PRACTICE OF GERI
- Page 1022:
514 PRINCIPLES AND PRACTICE OF GERI
- Page 1026:
Principles and Practice of Geriatri
- Page 1030:
REHABILITATION AND LONG-TERM MANAGE
- Page 1034:
Principles and Practice of Geriatri
- Page 1038:
TREATMENT OF LATE-ONSET PSYCHOTIC D
- Page 1042:
TREATMENT OF LATE-ONSET PSYCHOTIC D
- Page 1046:
528 PRINCIPLES AND PRACTICE OF GERI
- Page 1050:
530 PRINCIPLES AND PRACTICE OF GERI
- Page 1054:
532 PRINCIPLES AND PRACTICE OF GERI
- Page 1058:
Principles and Practice of Geriatri
- Page 1062:
538 PRINCIPLES AND PRACTICE OF GERI
- Page 1066:
540 PRINCIPLES AND PRACTICE OF GERI
- Page 1070:
542 PRINCIPLES AND PRACTICE OF GERI
- Page 1074:
Principles and Practice of Geriatri
- Page 1078:
STRESS, COPING AND SOCIAL SUPPORT 5
- Page 1082:
STRESS, COPING AND SOCIAL SUPPORT 5
- Page 1086:
552 PRINCIPLES AND PRACTICE OF GERI
- Page 1090:
554 PRINCIPLES AND PRACTICE OF GERI
- Page 1094:
556 PRINCIPLES AND PRACTICE OF GERI
- Page 1098:
Principles and Practice of Geriatri
- Page 1102:
ACUTE MANAGEMENT OF ANXIETY AND PHO
- Page 1106:
564 PRINCIPLES AND PRACTICE OF GERI
- Page 1110:
566 PRINCIPLES AND PRACTICE OF GERI
- Page 1114:
568 PRINCIPLES AND PRACTICE OF GERI
- Page 1118:
Principles and Practice of Geriatri
- Page 1122:
OBSESSIVE-COMPULSIVE DISORDER 5733.
- Page 1126:
576 PRINCIPLES AND PRACTICE OF GERI
- Page 1130:
Principles and Practice of Geriatri
- Page 1134:
OTHER NEUROTIC DISORDERS 581common
- Page 1138:
OTHER NEUROTIC DISORDERS 583Therapy
- Page 1142:
Principles and Practice of Geriatri
- Page 1146:
AETIOLOGY AND GENETICS 589and senso
- Page 1150:
AETIOLOGY AND GENETICS 59127. Verwo
- Page 1154:
594 PRINCIPLES AND PRACTICE OF GERI
- Page 1158:
596 PRINCIPLES AND PRACTICE OF GERI
- Page 1162:
598 PRINCIPLES AND PRACTICE OF GERI
- Page 1166:
Principles and Practice of Geriatri
- Page 1170:
ALCOHOL ABUSE 603elderly alcoholic
- Page 1174:
ALCOHOL ABUSE 60549. Sacco RL, Elki
- Page 1178:
608 PRINCIPLES AND PRACTICE OF GERI
- Page 1182:
610 PRINCIPLES AND PRACTICE OF GERI
- Page 1186:
612 PRINCIPLES AND PRACTICE OF GERI
- Page 1190:
614 PRINCIPLES AND PRACTICE OF GERI
- Page 1194:
616 PRINCIPLES AND PRACTICE OF GERI
- Page 1198:
618 PRINCIPLES AND PRACTICE OF GERI
- Page 1202:
Principles and Practice of Geriatri
- Page 1206:
Principles and Practice of Geriatri
- Page 1210:
624 PRINCIPLES AND PRACTICE OF GERI
- Page 1214:
Principles and Practice of Geriatri
- Page 1218:
ELDERLY OFFENDERS 629although there
- Page 1222:
632 PRINCIPLES AND PRACTICE OF GERI
- Page 1226:
Principles and Practice of Geriatri
- Page 1230:
638 PRINCIPLES AND PRACTICE OF GERI
- Page 1234:
Principles and Practice of Geriatri
- Page 1238:
PSYCHIATRIC ASSESSMENT 64332. Jorm
- Page 1242:
Principles and Practice of Geriatri
- Page 1246:
650 PRINCIPLES AND PRACTICE OF GERI
- Page 1250:
652 PRINCIPLES AND PRACTICE OF GERI
- Page 1254:
Principles and Practice of Geriatri
- Page 1258:
Principles and Practice of Geriatri
- Page 1262:
UK HEALTH AND SOCIAL SERVICES 659A
- Page 1266:
Principles and Practice of Geriatri
- Page 1270:
THE PATTERN OF PSYCHOGERIATRIC SERV
- Page 1274:
THE PATTERN OF PSYCHOGERIATRIC SERV
- Page 1278:
668 PRINCIPLES AND PRACTICE OF GERI
- Page 1282:
Principles and Practice of Geriatri
- Page 1286:
COMMUNITY CARE: THE BACKGROUND 673T
- Page 1290:
674 PRINCIPLES AND PRACTICE OF GERI
- Page 1294:
Principles and Practice of Geriatri
- Page 1298:
DEVELOPMENT OF DAY HOSPITALS AND DA
- Page 1302:
682 PRINCIPLES AND PRACTICE OF GERI
- Page 1306:
Principles and Practice of Geriatri
- Page 1310:
NEW TECHNOLOGY AND CARE OF THE COGN
- Page 1314:
690 PRINCIPLES AND PRACTICE OF GERI
- Page 1318:
692 PRINCIPLES AND PRACTICE OF GERI
- Page 1322:
694 PRINCIPLES AND PRACTICE OF GERI
- Page 1326:
696 PRINCIPLES AND PRACTICE OF GERI
- Page 1330:
698 PRINCIPLES AND PRACTICE OF GERI
- Page 1334:
700 PRINCIPLES AND PRACTICE OF GERI
- Page 1338:
702 PRINCIPLES AND PRACTICE OF GERI
- Page 1342:
Principles and Practice of Geriatri
- Page 1346:
THE PSYCHIATRIST’S ROLE IN LINKIN
- Page 1350:
Principles and Practice of Geriatri
- Page 1354:
THE MEDICAL PSYCHIATRY INPATIENT UN
- Page 1358:
Principles and Practice of Geriatri
- Page 1362:
Principles and Practice of Geriatri
- Page 1366:
718 PRINCIPLES AND PRACTICE OF GERI
- Page 1370:
720 PRINCIPLES AND PRACTICE OF GERI
- Page 1374:
722 PRINCIPLES AND PRACTICE OF GERI
- Page 1378:
724 PRINCIPLES AND PRACTICE OF GERI
- Page 1382:
726 PRINCIPLES AND PRACTICE OF GERI
- Page 1386:
728 PRINCIPLES AND PRACTICE OF GERI
- Page 1390:
Principles and Practice of Geriatri
- Page 1394:
LIAISON WITH MEDICAL AND SURGICAL T
- Page 1398:
LIAISON WITH MEDICAL AND SURGICAL T
- Page 1402:
738 PRINCIPLES AND PRACTICE OF GERI
- Page 1406:
740 PRINCIPLES AND PRACTICE OF GERI
- Page 1410:
742 PRINCIPLES AND PRACTICE OF GERI
- Page 1414:
744 PRINCIPLES AND PRACTICE OF GERI
- Page 1418:
746 PRINCIPLES AND PRACTICE OF GERI
- Page 1422:
748 PRINCIPLES AND PRACTICE OF GERI
- Page 1426:
750 PRINCIPLES AND PRACTICE OF GERI
- Page 1430:
752 PRINCIPLES AND PRACTICE OF GERI
- Page 1434:
NUTRITIONAL STATE 753By early 1999,
- Page 1438:
756 PRINCIPLES AND PRACTICE OF GERI
- Page 1442:
758 PRINCIPLES AND PRACTICE OF GERI
- Page 1446:
760 PRINCIPLES AND PRACTICE OF GERI
- Page 1450:
762 PRINCIPLES AND PRACTICE OF GERI
- Page 1454:
CAREGIVERS AND THEIR SUPPORT 763Exa
- Page 1458:
CAREGIVERS AND THEIR SUPPORT 765Tab
- Page 1462:
CAREGIVERS AND THEIR SUPPORT 767Fig
- Page 1466:
CAREGIVERS AND THEIR SUPPORT 76920.
- Page 1470:
772 PRINCIPLES AND PRACTICE OF GERI
- Page 1474:
Principles and Practice of Geriatri
- Page 1478:
CARE OF THE DYING PATIENT 777patien
- Page 1482:
Principles and Practice of Geriatri
- Page 1486:
PREVENTION IN LATE-LIFE MENTAL DISO
- Page 1490:
Principles and Practice of Geriatri
- Page 1494:
LAW AND THE ELDERLY INCOMPETENT PAT
- Page 1498:
LAW AND THE ELDERLY INCOMPETENT PAT
- Page 1502:
790 PRINCIPLES AND PRACTICE OF GERI
- Page 1506:
792 PRINCIPLES AND PRACTICE OF GERI
- Page 1510:
Principles and Practice of Geriatri
- Page 1514:
796 PRINCIPLES AND PRACTICE OF GERI
- Page 1518:
798 PRINCIPLES AND PRACTICE OF GERI
- Page 1522:
800 PRINCIPLES AND PRACTICE OF GERI