
You also want an ePaper? Increase the reach of your titles
YUMPU automatically turns print PDFs into web optimized ePapers that Google loves.
– 2.22 –<br />
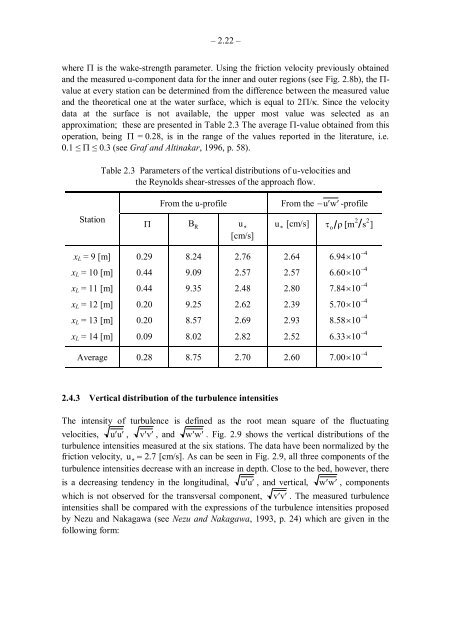
where � is the wake-strength parameter. Using the friction velocity previously obtained<br />
and the measured u-component data for the inner and outer regions (see Fig. 2.8b), the �value<br />
at every station can be determined from the difference between the measured value<br />
and the theoretical one at the water surface, which is equal to 2���. Since the velocity<br />
data at the surface is not available, the upper most value was selected as an<br />
approximation; these are presented in Table 2.3 The average �-value obtained from this<br />
operation, being � = 0.28, is in the range of the values reported in the literature, i.e.<br />
0.1 ≤ � ≤ 0.3 (see Graf and Altinakar, 1996, p. 58).<br />
Station<br />
Table 2.3 Parameters of the vertical distributions of u-velocities and<br />
the Reynolds shear-stresses of the approach flow.<br />
From the u-profile From the �u �� w ��-profile<br />
�� B R u �<br />
[cm/s]<br />
u � [cm/s] � o � [m 2 s 2 ]<br />
xL = 9 [m] 0.29 8.24 2.76 2.64 6.94�10 �4<br />
xL = 10 [m] 0.44 9.09 2.57 2.57 6.60�10 �4<br />
xL = 11 [m] 0.44 9.35 2.48 2.80 7.84�10 �4<br />
xL = 12 [m] 0.20 9.25 2.62 2.39 5.70�10 �4<br />
xL = 13 [m] 0.20 8.57 2.69 2.93 8.58�10 �4<br />
xL = 14 [m] 0.09 8.02 2.82 2.52 6.33�10 �4<br />
Average 0.28 8.75 2.70 2.60 7.00�10 �4<br />
2.4.3 Vertical distribution of the turbulence intensities<br />
The intensity of turbulence is defined as the root mean square of the fluctuating<br />
velocities, u �� u ��,<br />
v �� v ��,<br />
and w ��w<br />
��.<br />
Fig. 2.9 shows the vertical distributions of the<br />
turbulence intensities measured at the six stations. The data have been normalized by the<br />
friction velocity, u� � 2.7 [cm/s]. As can be seen in Fig. 2.9, all three components of the<br />
turbulence intensities decrease with an increase in depth. Close to the bed, however, there<br />
is a decreasing tendency in the longitudinal, u �� u ��,<br />
and vertical, w ��w<br />
��,<br />
components<br />
which is not observed for the transversal component, v �� v ��.<br />
The measured turbulence<br />
intensities shall be compared with the expressions of the turbulence intensities proposed<br />
by Nezu and Nakagawa (see Nezu and Nakagawa, 1993, p. 24) which are given in the<br />
following form: