

March - CI Investments
March - CI Investments
March - CI Investments
- No tags were found...

You also want an ePaper? Increase the reach of your titles
YUMPU automatically turns print PDFs into web optimized ePapers that Google loves.
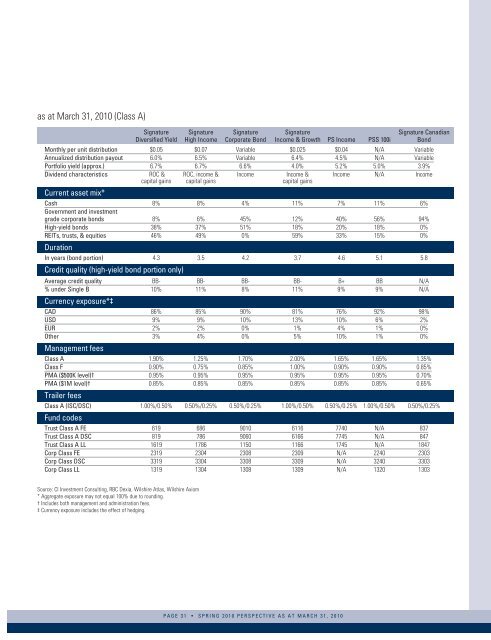
as at <strong>March</strong> 31, 2010 (Class A)Signature Signature Signature Signature Signature CanadianDiversified Yield High Income Corporate Bond Income & Growth PS Income PSS 100i BondMonthly per unit distribution $0.05 $0.07 Variable $0.025 $0.04 N/A VariableAnnualized distribution payout 6.0% 6.5% Variable 6.4% 4.5% N/A VariablePortfolio yield (approx.) 6.7% 6.7% 6.6% 4.0% 5.2% 5.0% 3.9%Dividend characteristics ROC & ROC, income & Income Income & Income N/A Incomecapital gains capital gains capital gainsCurrent asset mix*Cash 8% 8% 4% 11% 7% 11% 6%Government and investmentgrade corporate bonds 8% 6% 45% 12% 40% 56% 94%High-yield bonds 38% 37% 51% 18% 20% 18% 0%REITs, trusts, & equities 46% 49% 0% 59% 33% 15% 0%DurationIn years (bond portion) 4.3 3.5 4.2 3.7 4.6 5.1 5.8Credit quality (high-yield bond portion only)Average credit quality BB- BB- BB- BB- B+ BB N/A% under Single B 10% 11% 8% 11% 9% 9% N/ACurrency exposure*‡CAD 86% 85% 90% 81% 76% 92% 98%USD 9% 9% 10% 13% 10% 6% 2%EUR 2% 2% 0% 1% 4% 1% 0%Other 3% 4% 0% 5% 10% 1% 0%Management feesClass A 1.90% 1.25% 1.70% 2.00% 1.65% 1.65% 1.35%Class F 0.90% 0.75% 0.85% 1.00% 0.90% 0.90% 0.85%PMA ($500K level)† 0.95% 0.95% 0.95% 0.95% 0.95% 0.95% 0.70%PMA ($1M level)† 0.85% 0.85% 0.85% 0.85% 0.85% 0.85% 0.65%Trailer feesClass A (ISC/DSC) 1.00%/0.50% 0.50%/0.25% 0.50%/0.25% 1.00%/0.50% 0.50%/0.25% 1.00%/0.50% 0.50%/0.25%Fund codesTrust Class A FE 619 686 9010 6116 7740 N/A 837Trust Class A DSC 819 786 9060 6166 7745 N/A 847Trust Class A LL 1619 1786 1150 1166 1745 N/A 1847Corp Class FE 2319 2304 2308 2309 N/A 2240 2303Corp Class DSC 3319 3304 3308 3309 N/A 3240 3303Corp Class LL 1319 1304 1308 1309 N/A 1320 1303Source: <strong>CI</strong> Investment Consulting, RBC Dexia, Wilshire Atlas, Wilshire Axiom* Aggregate exposure may not equal 100% due to rounding.† Includes both management and administration fees.‡ Currency exposure includes the effect of hedging.PAGE 31 • SPRING 2010 PERSPECTIVE AS AT MARCH 31, 2010


