

March - CI Investments
March - CI Investments
March - CI Investments
- No tags were found...

Create successful ePaper yourself
Turn your PDF publications into a flip-book with our unique Google optimized e-Paper software.
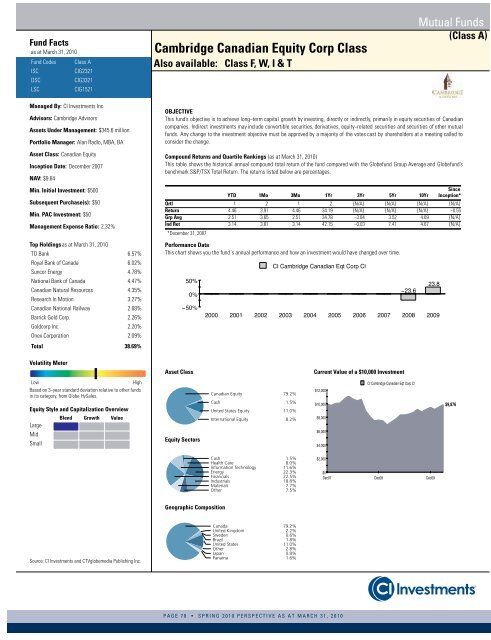
Fund Factsas at <strong>March</strong> 31, 2010Fund CodesISCDSCLSCClass A<strong>CI</strong>G2321<strong>CI</strong>G3321<strong>CI</strong>G1521Cambridge Canadian Equity Corp ClassAlso available: Class F, W, I & TMutual Funds(Class A)Managed By: <strong>CI</strong> <strong>Investments</strong> Inc.Advisors: Cambridge AdvisorsAssets Under Management: $345.6 millionPortfolio Manager: Alan Radlo, MBA, BAAsset Class: Canadian EquityInception Date: December 2007NAV: $9.84Min. Initial Investment: $500Subsequent Purchase(s): $50Min. PAC Investment: $50Management Expense Ratio: 2.32%Top Holdingsas at <strong>March</strong> 31, 2010TD Bank 6.57%Royal Bank of Canada 6.02%Suncor Energy 4.78%National Bank of Canada 4.47%Canadian Natural Resources 4.35%Research In Motion 3.27%Canadian National Railway 2.68%Barrick Gold Corp. 2.26%Goldcorp Inc. 2.20%Onex Corporation 2.09%Total 38.69%OBJECTIVEThis fund’s objective is to achieve long−term capital growth by investing, directly or indirectly, primarily in equity securities of Canadiancompanies. Indirect investments may include convertible securities, derivatives, equity−related securities and securities of other mutualfunds. Any change to the investment objective must be approved by a majority of the votes cast by shareholders at a meeting called toconsider the change.Compound Returns and Quartile Rankings (as at <strong>March</strong> 31, 2010)This table shows the historical annual compound total return of the fund compared with the Globefund Group Average and Globefund’sbenchmark S&P/TSX Total Return. The returns listed below are percentages.YTD 1Mo 3Mo 1Yr 3Yr 5Yr 10YrSinceInception*Qrtl 1 2 1 2 {N/A} {N/A} {N/A} {N/A}Return 4.46 3.91 4.46 34.19 {N/A} {N/A} {N/A} −0.55Grp Avg 2.51 3.65 2.51 34.78 −3.84 3.52 4.69 {N/A}Ind Ret 3.14 3.81 3.14 42.15 −0.03 7.41 4.67 {N/A}*December 31, 2007Performance DataThis chart shows you the fund´s annual performance and how an investment would have changed over time. Volatility MeterAsset ClassCurrent Value of a $10,000 InvestmentLowHighBased on 3−year standard deviation relative to other fundsin its category, from Globe HySales.Equity Style and Capitalization OverviewLargeMidSmallBlend Growth ValueEquity SectorsCanadian Equity 79.2%Cash 1.5%United States Equity 11.0%International Equity 8.2%Cash 1.5%Health Care 8.0%Information Technology 11.6%Energy 22.3%Financials 22.5%Industrials 18.8%Materials 7.7%Other 7.5% Geographic CompositionSource: <strong>CI</strong> <strong>Investments</strong> and CTVglobemedia Publishing Inc.Canada 79.2%United Kingdom 2.2%Sweden 0.6%Brazil 1.8%United States 11.0%Other 2.8%Japan 0.8%Panama 1.6%PAGE 70 • SPRING 2010 PERSPECTIVE AS AT MARCH 31, 2010


