

March - CI Investments
March - CI Investments
March - CI Investments
- No tags were found...

Create successful ePaper yourself
Turn your PDF publications into a flip-book with our unique Google optimized e-Paper software.
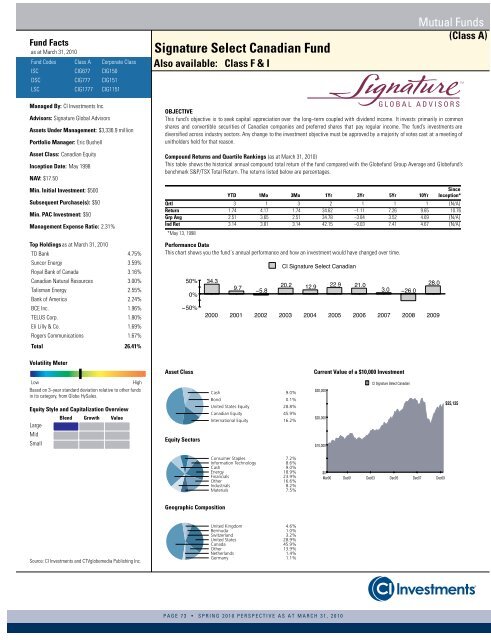
Fund Factsas at <strong>March</strong> 31, 2010Fund Codes Class A Corporate ClassISC <strong>CI</strong>G677 <strong>CI</strong>G150DSC <strong>CI</strong>G777 <strong>CI</strong>G151LSC <strong>CI</strong>G1777 <strong>CI</strong>G1151Signature Select Canadian FundAlso available: Class F & IMutual Funds(Class A)Managed By: <strong>CI</strong> <strong>Investments</strong> Inc.Advisors: Signature Global AdvisorsAssets Under Management: $3,336.9 millionPortfolio Manager: Eric BushellAsset Class: Canadian EquityInception Date: May 1998NAV: $17.50Min. Initial Investment: $500Subsequent Purchase(s): $50Min. PAC Investment: $50Management Expense Ratio: 2.31%Top Holdingsas at <strong>March</strong> 31, 2010TD Bank 4.75%Suncor Energy 3.59%Royal Bank of Canada 3.16%Canadian Natural Resources 3.00%Talisman Energy 2.55%Bank of America 2.24%BCE Inc. 1.96%TELUS Corp. 1.80%Eli Lilly & Co. 1.69%Rogers Communications 1.67%Total 26.41%OBJECTIVEThis fund’s objective is to seek capital appreciation over the long−term coupled with dividend income. It invests primarily in commonshares and convertible securities of Canadian companies and preferred shares that pay regular income. The fund’s investments arediversified across industry sectors. Any change to the investment objective must be approved by a majority of votes cast at a meeting ofunitholders held for that reason.Compound Returns and Quartile Rankings (as at <strong>March</strong> 31, 2010)This table shows the historical annual compound total return of the fund compared with the Globefund Group Average and Globefund’sbenchmark S&P/TSX Total Return. The returns listed below are percentages.YTD 1Mo 3Mo 1Yr 3Yr 5Yr 10YrSinceInception*Qrtl 3 1 3 2 1 1 1 {N/A}Return 1.74 4.17 1.74 34.62 −1.11 7.26 9.65 10.76Grp Avg 2.51 3.65 2.51 34.78 −3.84 3.52 4.69 {N/A}Ind Ret 3.14 3.81 3.14 42.15 −0.03 7.41 4.67 {N/A}*May 13, 1998Performance DataThis chart shows you the fund´s annual performance and how an investment would have changed over time. Volatility MeterAsset ClassCurrent Value of a $10,000 InvestmentLowHighBased on 3−year standard deviation relative to other fundsin its category, from Globe HySales.Equity Style and Capitalization OverviewLargeMidSmallBlend Growth ValueEquity SectorsCash 9.0%Bond 0.1%United States Equity 28.8%Canadian Equity 45.9%International Equity 16.2%Consumer Staples 7.2%Information Technology 8.6%Cash 9.0%Energy 18.9%Financials 23.9%Other 16.6%Industrials 8.2%Materials 7.5% Geographic CompositionSource: <strong>CI</strong> <strong>Investments</strong> and CTVglobemedia Publishing Inc.United Kingdom 4.6%Bermuda 1.0%Switzerland 3.2%United States 28.9%Canada 45.9%Other 13.9%Netherlands 1.4%Germany 1.1%PAGE 73 • SPRING 2010 PERSPECTIVE AS AT MARCH 31, 2010


