

March - CI Investments
March - CI Investments
March - CI Investments
- No tags were found...

Create successful ePaper yourself
Turn your PDF publications into a flip-book with our unique Google optimized e-Paper software.
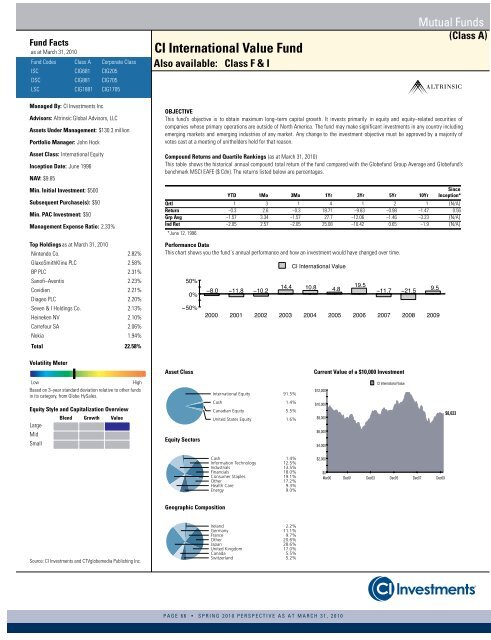
Fund Factsas at <strong>March</strong> 31, 2010Fund Codes Class A Corporate ClassISC <strong>CI</strong>G681 <strong>CI</strong>G205DSC <strong>CI</strong>G881 <strong>CI</strong>G705LSC <strong>CI</strong>G1881 <strong>CI</strong>G1705<strong>CI</strong> International Value FundAlso available: Class F & IMutual Funds(Class A)Managed By: <strong>CI</strong> <strong>Investments</strong> Inc.Advisors: Altrinsic Global Advisors, LLCAssets Under Management: $130.3 millionPortfolio Manager: John HockAsset Class: International EquityInception Date: June 1996NAV: $9.85Min. Initial Investment: $500Subsequent Purchase(s): $50Min. PAC Investment: $50Management Expense Ratio: 2.33%Top Holdingsas at <strong>March</strong> 31, 2010Nintendo Co. 2.82%GlaxoSmithKline PLC 2.58%BP PLC 2.31%Sanofi−Aventis 2.23%Covidien 2.21%Diageo PLC 2.20%Seven & I Holdings Co. 2.13%Heineken NV 2.10%Carrefour SA 2.06%Nokia 1.94%Total 22.58%OBJECTIVEThis fund’s objective is to obtain maximum long−term capital growth. It invests primarily in equity and equity−related securities ofcompanies whose primary operations are outside of North America. The fund may make significant investments in any country includingemerging markets and emerging industries of any market. Any change to the investment objective must be approved by a majority ofvotes cast at a meeting of unitholders held for that reason.Compound Returns and Quartile Rankings (as at <strong>March</strong> 31, 2010)This table shows the historical annual compound total return of the fund compared with the Globefund Group Average and Globefund’sbenchmark MS<strong>CI</strong> EAFE ($ Cdn). The returns listed below are percentages.YTD 1Mo 3Mo 1Yr 3Yr 5Yr 10YrSinceInception*Qrtl 1 3 1 4 1 2 1 {N/A}Return −0.3 2.6 −0.3 18.71 −9.63 −0.98 −1.47 0.56Grp Avg −1.57 3.34 −1.57 27.7 −12.06 −1.46 −3.23 {N/A}Ind Ret −2.05 2.57 −2.05 25.08 −10.42 0.65 −1.9 {N/A}*June 12, 1996Performance DataThis chart shows you the fund´s annual performance and how an investment would have changed over time. Volatility MeterAsset ClassCurrent Value of a $10,000 InvestmentLowHighBased on 3−year standard deviation relative to other fundsin its category, from Globe HySales.Equity Style and Capitalization OverviewLargeMidSmallBlend Growth ValueEquity SectorsInternational Equity 91.5%Cash 1.4%Canadian Equity 5.5%United States Equity 1.6%Cash 1.4%Information Technology 12.5%Industrials 13.5%Financials 18.0%Consumer Staples 19.1%Other 17.2%Health Care 9.3%Energy 9.0% Geographic CompositionSource: <strong>CI</strong> <strong>Investments</strong> and CTVglobemedia Publishing Inc.Ireland 2.2%Germany 11.1%France 9.7%Other 20.6%Japan 28.6%United Kingdom 17.0%Canada 5.5%Switzerland 5.2%PAGE 66 • SPRING 2010 PERSPECTIVE AS AT MARCH 31, 2010


