

March - CI Investments
March - CI Investments
March - CI Investments
- No tags were found...

You also want an ePaper? Increase the reach of your titles
YUMPU automatically turns print PDFs into web optimized ePapers that Google loves.
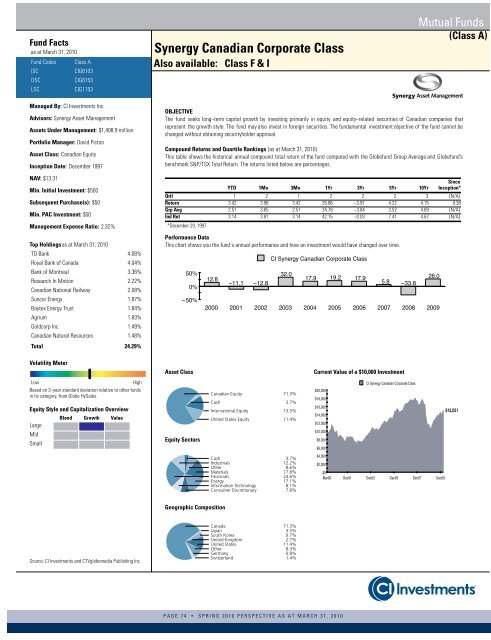
Fund Factsas at <strong>March</strong> 31, 2010Fund CodesISCDSCLSCClass A<strong>CI</strong>G6103<strong>CI</strong>G6153<strong>CI</strong>G1153Synergy Canadian Corporate ClassAlso available: Class F & IMutual Funds(Class A)Managed By: <strong>CI</strong> <strong>Investments</strong> Inc.Advisors: Synergy Asset ManagementAssets Under Management: $1,408.9 millionPortfolio Manager: David PictonAsset Class: Canadian EquityInception Date: December 1997NAV: $13.31Min. Initial Investment: $500Subsequent Purchase(s): $50Min. PAC Investment: $50Management Expense Ratio: 2.32%Top Holdingsas at <strong>March</strong> 31, 2010TD Bank 4.08%Royal Bank of Canada 4.04%Bank of Montreal 3.36%Research In Motion 2.22%Canadian National Railway 2.08%Suncor Energy 1.87%Baytex Energy Trust 1.84%Agrium 1.83%Goldcorp Inc. 1.49%Canadian Natural Resources 1.48%Total 24.29%OBJECTIVEThe fund seeks long−term capital growth by investing primarily in equity and equity−related securities of Canadian companies thatrepresent the growth style. The fund may also invest in foreign securities. The fundamental investment objective of the fund cannot bechanged without obtaining securityholder approval.Compound Returns and Quartile Rankings (as at <strong>March</strong> 31, 2010)This table shows the historical annual compound total return of the fund compared with the Globefund Group Average and Globefund’sbenchmark S&P/TSX Total Return. The returns listed below are percentages.YTD 1Mo 3Mo 1Yr 3Yr 5Yr 10YrSinceInception*Qrtl 1 2 1 2 2 2 3 {N/A}Return 3.42 3.98 3.42 35.86 −3.91 4.22 4.15 9.38Grp Avg 2.51 3.65 2.51 34.78 −3.84 3.52 4.69 {N/A}Ind Ret 3.14 3.81 3.14 42.15 −0.03 7.41 4.67 {N/A}*December 29, 1997Performance DataThis chart shows you the fund´s annual performance and how an investment would have changed over time. Volatility MeterAsset ClassCurrent Value of a $10,000 InvestmentLowHighBased on 3−year standard deviation relative to other fundsin its category, from Globe HySales.Equity Style and Capitalization OverviewLargeMidSmallBlend Growth ValueEquity SectorsCanadian Equity 71.3%Cash 3.7%International Equity 13.5%United States Equity 11.4%Cash 3.7%Industrials 12.2%Other 8.6%Materials 17.8%Financials 24.6%Energy 17.1%Information Technology 8.1%Consumer Discretionary 7.8% Geographic CompositionSource: <strong>CI</strong> <strong>Investments</strong> and CTVglobemedia Publishing Inc.Canada 71.3%Japan 3.3%South Korea 0.7%United Kingdom 2.7%United States 11.4%Other 8.3%Germany 0.8%Switzerland 1.4%PAGE 74 • SPRING 2010 PERSPECTIVE AS AT MARCH 31, 2010


