

March - CI Investments
March - CI Investments
March - CI Investments
- No tags were found...

Create successful ePaper yourself
Turn your PDF publications into a flip-book with our unique Google optimized e-Paper software.
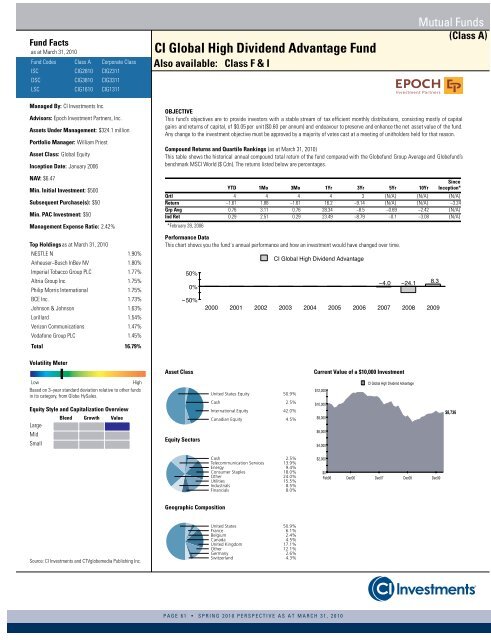
Fund Factsas at <strong>March</strong> 31, 2010Fund Codes Class A Corporate ClassISC <strong>CI</strong>G2810 <strong>CI</strong>G2311DSC <strong>CI</strong>G3810 <strong>CI</strong>G3311LSC <strong>CI</strong>G1610 <strong>CI</strong>G1311<strong>CI</strong> Global High Dividend Advantage FundAlso available: Class F & IMutual Funds(Class A)Managed By: <strong>CI</strong> <strong>Investments</strong> Inc.Advisors: Epoch Investment Partners, Inc.Assets Under Management: $324.1 millionPortfolio Manager: William PriestAsset Class: Global EquityInception Date: January 2006NAV: $6.47Min. Initial Investment: $500Subsequent Purchase(s): $50Min. PAC Investment: $50Management Expense Ratio: 2.42%Top Holdingsas at <strong>March</strong> 31, 2010NESTLE N 1.90%Anheuser−Busch InBev NV 1.80%Imperial Tobacco Group PLC 1.77%Altria Group Inc. 1.75%Philip Morris International 1.75%BCE Inc. 1.73%Johnson & Johnson 1.63%Lorillard 1.54%Verizon Communications 1.47%Vodafone Group PLC 1.45%Total 16.79%OBJECTIVEThis fund’s objectives are to provide investors with a stable stream of tax efficient monthly distributions, consisting mostly of capitalgains and returns of capital, of $0.05 per unit($0.60 per annum) and endeavour to preserve and enhance the net asset value of the fund.Any change to the investment objective must be approved by a majority of votes cast at a meeting of unitholders held for that reason.Compound Returns and Quartile Rankings (as at <strong>March</strong> 31, 2010)This table shows the historical annual compound total return of the fund compared with the Globefund Group Average and Globefund’sbenchmark MS<strong>CI</strong> World ($ Cdn). The returns listed below are percentages.YTD 1Mo 3Mo 1Yr 3Yr 5Yr 10YrSinceInception*Qrtl 4 4 4 4 3 {N/A} {N/A} {N/A}Return −1.61 1.88 −1.61 16.2 −9.14 {N/A} {N/A} −3.24Grp Avg 0.76 3.11 0.76 28.34 −8.5 −0.69 −2.42 {N/A}Ind Ret 0.29 2.51 0.29 23.49 −8.79 −0.1 −3.08 {N/A}*February 28, 2006Performance DataThis chart shows you the fund´s annual performance and how an investment would have changed over time. Volatility MeterAsset ClassCurrent Value of a $10,000 InvestmentLowHighBased on 3−year standard deviation relative to other fundsin its category, from Globe HySales.Equity Style and Capitalization OverviewLargeMidSmallBlend Growth ValueEquity SectorsUnited States Equity 50.9%Cash 2.5%International Equity 42.0%Canadian Equity 4.5%Cash 2.5%Telecommunication Services 13.9%Energy 9.4%Consumer Staples 18.0%Other 24.0%Utilities 15.5%Industrials 8.5%Financials 8.0% Geographic CompositionSource: <strong>CI</strong> <strong>Investments</strong> and CTVglobemedia Publishing Inc.United States 50.9%France 6.1%Belgium 2.4%Canada 4.5%United Kingdom 17.1%Other 12.1%Germany 2.6%Switzerland 4.3%PAGE 61 • SPRING 2010 PERSPECTIVE AS AT MARCH 31, 2010


