

March - CI Investments
March - CI Investments
March - CI Investments
- No tags were found...

You also want an ePaper? Increase the reach of your titles
YUMPU automatically turns print PDFs into web optimized ePapers that Google loves.
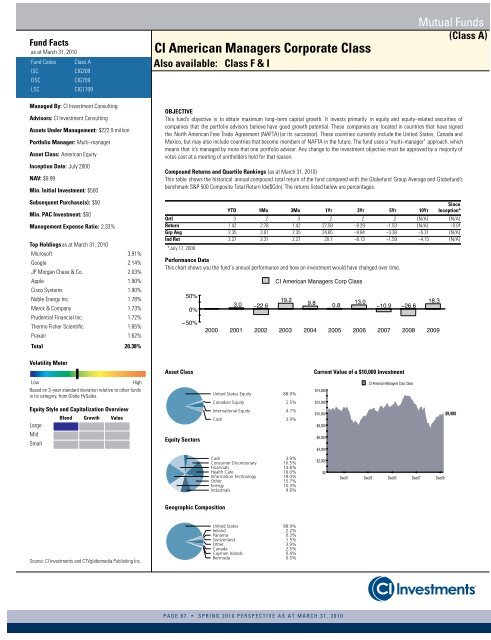
Fund Factsas at <strong>March</strong> 31, 2010Fund CodesISCDSCLSCClass A<strong>CI</strong>G209<strong>CI</strong>G709<strong>CI</strong>G1709<strong>CI</strong> American Managers Corporate ClassAlso available: Class F & IMutual Funds(Class A)Managed By: <strong>CI</strong> Investment ConsultingAdvisors: <strong>CI</strong> Investment ConsultingAssets Under Management: $222.9 millionPortfolio Manager: Multi−managerAsset Class: American EquityInception Date: July 2000NAV: $9.99Min. Initial Investment: $500Subsequent Purchase(s): $50Min. PAC Investment: $50Management Expense Ratio: 2.33%Top Holdingsas at <strong>March</strong> 31, 2010Microsoft 3.91%Google 2.14%JP Morgan Chase & Co. 2.03%Apple 1.90%Cisco Systems 1.90%Noble Energy Inc. 1.78%Merck & Company 1.73%Prudential Financial Inc. 1.72%Thermo Fisher Scientific 1.65%Praxair 1.62%Total 20.38%OBJECTIVEThis fund’s objective is to obtain maximum long−term capital growth. It invests primarily in equity and equity−related securities ofcompanies that the portfolio advisors believe have good growth potential. These companies are located in countries that have signedthe North American Free Trade Agreement (NAFTA) (or its successor). These countries currently include the United States, Canada andMexico, but may also include countries that become members of NAFTA in the future. The fund uses a "multi−manager" approach, whichmeans that it’s managed by more that one portfolio advisor. Any change to the investment objective must be approved by a majority ofvotes cast at a meeting of unitholders held for that reason.Compound Returns and Quartile Rankings (as at <strong>March</strong> 31, 2010)This table shows the historical annual compound total return of the fund compared with the Globefund Group Average and Globefund’sbenchmark S&P 500 Composite Total Return Idx($Cdn). The returns listed below are percentages.YTD 1Mo 3Mo 1Yr 3Yr 5Yr 10YrSinceInception*Qrtl 3 2 3 2 2 2 {N/A} {N/A}Return 1.42 2.78 1.42 27.59 −8.29 −1.53 {N/A} −0.01Grp Avg 2.35 3.01 2.35 24.65 −9.84 −3.38 −5.31 {N/A}Ind Ret 2.27 2.31 2.27 20.7 −8.13 −1.59 −4.15 {N/A}*July 17, 2000Performance DataThis chart shows you the fund´s annual performance and how an investment would have changed over time. Volatility MeterAsset ClassCurrent Value of a $10,000 InvestmentLowHighBased on 3−year standard deviation relative to other fundsin its category, from Globe HySales.Equity Style and Capitalization OverviewLargeMidSmallBlend Growth ValueEquity SectorsUnited States Equity 88.9%Canadian Equity 2.5%International Equity 4.7%Cash 3.9%Cash 3.9%Consumer Discretionary 10.5%Financials 14.8%Health Care 16.0%Information Technology 19.0%Other 15.7%Energy 10.3%Industrials 9.8% Geographic CompositionSource: <strong>CI</strong> <strong>Investments</strong> and CTVglobemedia Publishing Inc.United States 88.9%Ireland 2.2%Panama 0.3%Switzerland 1.5%Other 3.9%Canada 2.5%Cayman Islands 0.4%Bermuda 0.5%PAGE 67 • SPRING 2010 PERSPECTIVE AS AT MARCH 31, 2010


