

March - CI Investments
March - CI Investments
March - CI Investments
- No tags were found...

Create successful ePaper yourself
Turn your PDF publications into a flip-book with our unique Google optimized e-Paper software.
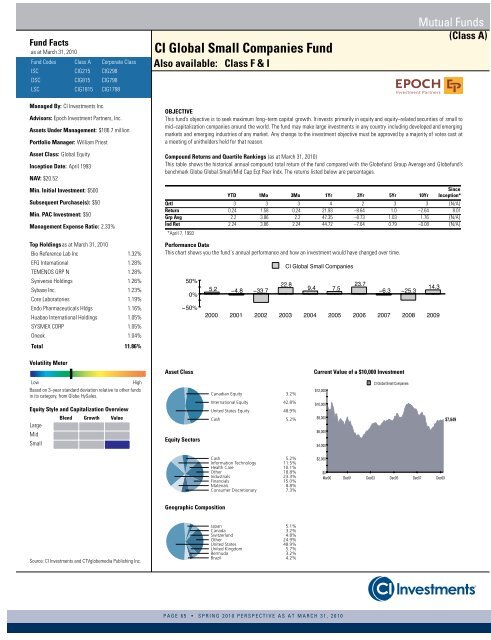
Fund Factsas at <strong>March</strong> 31, 2010Fund Codes Class A Corporate ClassISC <strong>CI</strong>G215 <strong>CI</strong>G298DSC <strong>CI</strong>G815 <strong>CI</strong>G798LSC <strong>CI</strong>G1815 <strong>CI</strong>G1798<strong>CI</strong> Global Small Companies FundAlso available: Class F & IMutual Funds(Class A)Managed By: <strong>CI</strong> <strong>Investments</strong> Inc.Advisors: Epoch Investment Partners, Inc.Assets Under Management: $186.7 millionPortfolio Manager: William PriestAsset Class: Global EquityInception Date: April 1993NAV: $20.52Min. Initial Investment: $500Subsequent Purchase(s): $50Min. PAC Investment: $50Management Expense Ratio: 2.33%Top Holdingsas at <strong>March</strong> 31, 2010Bio Reference Lab Inc 1.32%EFG International 1.28%TEMENOS GRP N 1.28%Syniverse Holdings 1.26%Sybase Inc. 1.23%Core Laboratories 1.19%Endo Pharmaceuticals Hldgs 1.16%Huabao International Holdings 1.05%SYSMEX CORP 1.05%Oneok 1.04%Total 11.86%OBJECTIVEThis fund’sobjective is to seek maximum long−term capital growth. It invests primarily in equity and equity−related securities of small tomid−capitalization companies around the world. The fund may make large investments in any country including developed and emergingmarkets and emerging industries of any market. Any change to the investment objective must be approved by a majority of votes cast ata meeting of unitholders held for that reason.Compound Returns and Quartile Rankings (as at <strong>March</strong> 31, 2010)This table shows the historical annual compound total return of the fund compared with the Globefund Group Average and Globefund’sbenchmark Globe Global Small/Mid Cap Eqt Peer Indx. The returns listed below are percentages.YTD 1Mo 3Mo 1Yr 3Yr 5Yr 10YrSinceInception*Qrtl 3 3 3 4 2 3 3 {N/A}Return 0.24 1.58 0.24 21.93 −8.64 1.0 −2.64 8.01Grp Avg 2.2 3.86 2.2 47.35 −8.73 1.03 1.76 {N/A}Ind Ret 2.24 3.86 2.24 44.72 −7.64 0.79 −0.08 {N/A}*April 7, 1993Performance DataThis chart shows you the fund´s annual performance and how an investment would have changed over time. Volatility MeterAsset ClassCurrent Value of a $10,000 InvestmentLowHighBased on 3−year standard deviation relative to other fundsin its category, from Globe HySales.Equity Style and Capitalization OverviewLargeMidSmallBlend Growth ValueEquity SectorsCanadian Equity 3.2%International Equity 42.8%United States Equity 48.9%Cash 5.2%Cash 5.2%Information Technology 11.5%Health Care 10.1%Other 18.8%Industrials 23.3%Financials 15.0%Materials 8.8%Consumer Discretionary 7.3% Geographic CompositionSource: <strong>CI</strong> <strong>Investments</strong> and CTVglobemedia Publishing Inc.Japan 5.1%Canada 3.2%Switzerland 4.8%Other 24.9%United States 48.9%United Kingdom 5.7%Bermuda 3.2%Brazil 4.2%PAGE 65 • SPRING 2010 PERSPECTIVE AS AT MARCH 31, 2010


