

March - CI Investments
March - CI Investments
March - CI Investments
- No tags were found...

Create successful ePaper yourself
Turn your PDF publications into a flip-book with our unique Google optimized e-Paper software.
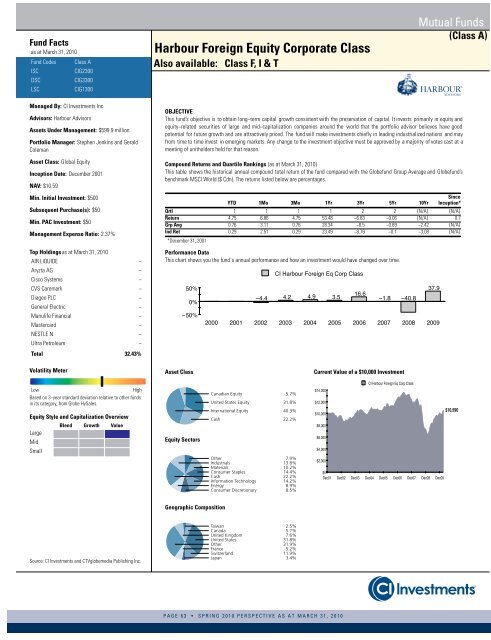
Fund Factsas at <strong>March</strong> 31, 2010Fund CodesISCDSCLSCClass A<strong>CI</strong>G2300<strong>CI</strong>G3300<strong>CI</strong>G1300Harbour Foreign Equity Corporate ClassAlso available: Class F, I & TMutual Funds(Class A)Managed By: <strong>CI</strong> <strong>Investments</strong> Inc.Advisors: Harbour AdvisorsAssets Under Management: $599.9 millionPortfolio Manager: Stephen Jenkins and GeraldColemanAsset Class: Global EquityInception Date: December 2001NAV: $10.59Min. Initial Investment: $500Subsequent Purchase(s): $50Min. PAC Investment: $50Management Expense Ratio: 2.37%Top Holdingsas at <strong>March</strong> 31, 2010AIR LIQUIDE−Aryzta AG−Cisco Systems−CVS Caremark−Diageo PLC−General Electric−Manulife Financial−Mastercard−NESTLE N−Ultra Petroleum−Total 32.43%OBJECTIVEThis fund’s objective is to obtain long−term capital growth consistent with the preservation of capital. It invests primarily in equity andequity−related securities of large and mid−capitalization companies around the world that the portfolio advisor believes have goodpotential for future growth and are attractively priced. The fund will make investments chiefly in leading industrialized nations and mayfrom time to time invest in emerging markets. Any change to the investment objective must be approved by a majority of votes cast at ameeting of unitholders held for that reason.Compound Returns and Quartile Rankings (as at <strong>March</strong> 31, 2010)This table shows the historical annual compound total return of the fund compared with the Globefund Group Average and Globefund’sbenchmark MS<strong>CI</strong> World ($ Cdn). The returns listed below are percentages.YTD 1Mo 3Mo 1Yr 3Yr 5Yr 10YrSinceInception*Qrtl 1 1 1 1 2 2 {N/A} {N/A}Return 4.75 6.86 4.75 53.48 −6.63 −0.06 {N/A} 0.7Grp Avg 0.76 3.11 0.76 28.34 −8.5 −0.69 −2.42 {N/A}Ind Ret 0.29 2.51 0.29 23.49 −8.79 −0.1 −3.08 {N/A}*December 31, 2001Performance DataThis chart shows you the fund´s annual performance and how an investment would have changed over time. Volatility MeterAsset ClassCurrent Value of a $10,000 InvestmentLowHighBased on 3−year standard deviation relative to other fundsin its category, from Globe HySales.Equity Style and Capitalization OverviewLargeMidSmallBlend Growth ValueEquity SectorsCanadian Equity 5.7%United States Equity 31.8%International Equity 40.3%Cash 22.2%Other 7.9%Industrials 13.8%Materials 10.2%Consumer Staples 14.4%Cash 22.2%Information Technology 14.2%Energy 8.9%Consumer Discretionary 8.5% Geographic CompositionSource: <strong>CI</strong> <strong>Investments</strong> and CTVglobemedia Publishing Inc.Taiwan 2.5%Canada 5.7%United Kingdom 7.6%United States 31.8%Other 31.9%France 5.2%Switzerland 11.9%Japan 3.4%PAGE 63 • SPRING 2010 PERSPECTIVE AS AT MARCH 31, 2010


