Varian Linatron High-Energy X-ray Applications 2007
Varian Linatron High-Energy X-ray Applications 2007
Varian Linatron High-Energy X-ray Applications 2007

You also want an ePaper? Increase the reach of your titles
YUMPU automatically turns print PDFs into web optimized ePapers that Google loves.
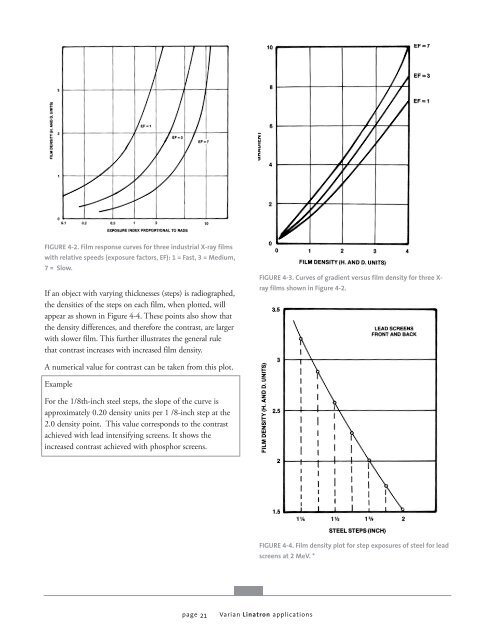
FIGURE 4-2. Film response curves for three industrial X-<strong>ray</strong> films<br />
with relative speeds (exposure factors, EF): 1 = Fast, 3 = Medium,<br />
7 = Slow.<br />
If an object with varying thicknesses (steps) is radiographed,<br />
the densities of the steps on each film, when plotted, will<br />
appear as shown in Figure 4-4. These points also show that<br />
the density differences, and therefore the contrast, are larger<br />
with slower film. This further illustrates the general rule<br />
that contrast increases with increased film density.<br />
A numerical value for contrast can be taken from this plot.<br />
Example<br />
For the 1/8th-inch steel steps, the slope of the curve is<br />
approximately 0.20 density units per 1 /8-inch step at the<br />
2.0 density point. This value corresponds to the contrast<br />
achieved with lead intensifying screens. It shows the<br />
increased contrast achieved with phosphor screens.<br />
page 21<br />
FIGURE 4-3. Curves of gradient versus film density for three X<strong>ray</strong><br />
films shown in Figure 4-2.<br />
FIGURE 4-4. Film density plot for step exposures of steel for lead<br />
screens at 2 MeV. *<br />
<strong>Varian</strong> <strong>Linatron</strong> applications


![[MSDS 126] Dow Corning 200 Fluid, 5 CST Part Number ... - Varian](https://img.yumpu.com/5104917/1/190x245/msds-126-dow-corning-200-fluid-5-cst-part-number-varian.jpg?quality=85)