Poverty Footprint Study on how the Coca Cola - Oxfam America
Poverty Footprint Study on how the Coca Cola - Oxfam America
Poverty Footprint Study on how the Coca Cola - Oxfam America

You also want an ePaper? Increase the reach of your titles
YUMPU automatically turns print PDFs into web optimized ePapers that Google loves.
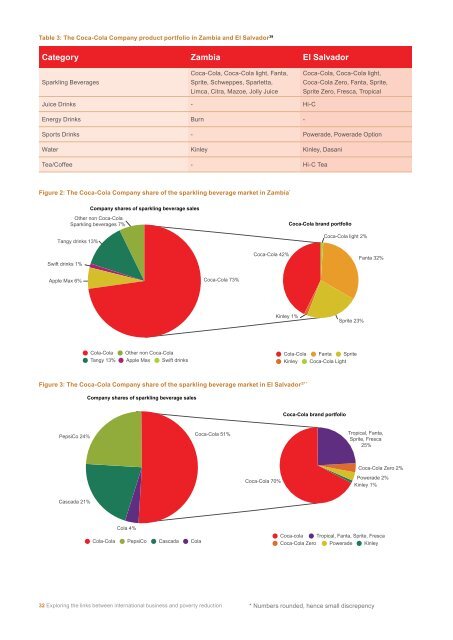
PepsiCo 24%<br />
<strong>Coca</strong>-<strong>Cola</strong> 51%<br />
Table 3: The <strong>Coca</strong>-<strong>Cola</strong> Company product portfolio in Zambia and El Salvador 39<br />
Category Zambia El Salvador<br />
Cascada 21%<br />
<strong>Coca</strong>-<strong>Cola</strong>, <strong>Coca</strong>-<strong>Cola</strong> light, Fanta, <strong>Coca</strong>-<strong>Cola</strong>, <strong>Coca</strong>-<strong>Cola</strong> light,<br />
Sparkling Beverages<br />
Sprite, Schweppes, Sparletta, <strong>Coca</strong>-<strong>Cola</strong> Zero, Fanta, Sprite,<br />
<strong>Cola</strong> 4%<br />
Limca, Citra, Mazoe, Jolly Juice Sprite Zero, Fresca, Tropical<br />
Juice Drinks -<br />
� <strong>Cola</strong>-<strong>Cola</strong> � PepsiCo � Cascada � <strong>Cola</strong><br />
� <strong>Coca</strong>-cola<br />
Hi-C<br />
� Tropical, Fanta, Sprite, Fresca<br />
� <strong>Coca</strong>-<strong>Cola</strong> Zero � Powerade � Kinley<br />
Energy Drinks Burn -<br />
Sports Drinks - Powerade, Powerade Opti<strong>on</strong><br />
Water Kinley Kinley, Dasani<br />
Tea/Coffee - Hi-C Tea<br />
O<strong>the</strong>r n<strong>on</strong> <strong>Coca</strong>-<strong>Cola</strong><br />
Sparkling beverages 7%<br />
32 Exploring <strong>the</strong> links between internati<strong>on</strong>al business and poverty reducti<strong>on</strong><br />
<strong>Coca</strong>-<strong>Cola</strong> 70%<br />
Figure 2: The <strong>Coca</strong>-<strong>Cola</strong> Company share of <strong>the</strong> sparkling beverage market in Zambia *<br />
Tangy drinks 13%<br />
Swift drinks 1%<br />
Apple Max 6%<br />
Company shares of sparkling beverage sales<br />
� <strong>Cola</strong>-<strong>Cola</strong> � O<strong>the</strong>r n<strong>on</strong> <strong>Coca</strong>-<strong>Cola</strong><br />
� Tangy 13% � Apple Max � Swift drinks<br />
<strong>Coca</strong>-<strong>Cola</strong> 73%<br />
<strong>Coca</strong>-<strong>Cola</strong> 42%<br />
Kinley 1%<br />
37 *<br />
Figure 3: The <strong>Coca</strong>-<strong>Cola</strong> Company share of <strong>the</strong> sparkling beverage market in El Salvador<br />
PepsiCo 24%<br />
Cascada 21%<br />
Company shares of sparkling beverage sales<br />
<strong>Cola</strong> 4%<br />
� <strong>Cola</strong>-<strong>Cola</strong> � PepsiCo � Cascada � <strong>Cola</strong><br />
<strong>Coca</strong>-<strong>Cola</strong> 51%<br />
<strong>Coca</strong>-<strong>Cola</strong> 70%<br />
<strong>Coca</strong>-<strong>Cola</strong> brand portfolio<br />
<strong>Coca</strong>-<strong>Cola</strong> light 2%<br />
Tropical, Fanta,<br />
Sprite, Fresca<br />
25%<br />
Sprite 23%<br />
� <strong>Cola</strong>-<strong>Cola</strong> � Fanta � Sprite<br />
� Kinley � <strong>Coca</strong>-<strong>Cola</strong> Light<br />
<strong>Coca</strong>-<strong>Cola</strong> brand portfolio<br />
<strong>Coca</strong>-<strong>Cola</strong> Zero 2%<br />
Powerade 2%<br />
Kinley 1%<br />
Fanta 32%<br />
Tropical, Fanta,<br />
Sprite, Fresca<br />
25%<br />
<strong>Coca</strong>-<strong>Cola</strong> Zero 2%<br />
Powerade 2%<br />
Kinley 1%<br />
� <strong>Coca</strong>-cola � Tropical, Fanta, Sprite, Fresca<br />
� <strong>Coca</strong>-<strong>Cola</strong> Zero � Powerade � Kinley<br />
* Numbers rounded, hence small discrepency