- Page 2:
PROSPERITY AND DEPRESSION
- Page 5 and 6:
PROSPERITY AND DEPRESSION was origi
- Page 7 and 8:
VIPre/tNtmore apt to meet the shock
- Page 10:
PREFACE TO THE 1939 EDITIONIn prepa
- Page 14:
CONTENTSINTRODUCTION .PART I. SYSTE
- Page 17 and 18:
XVIAnalYtical Table ofContentsA. TH
- Page 19 and 20:
XVIIIAnalYtical Table 0/· ContmtJc
- Page 21 and 22:
xxAna!Jtical Table of Contents§ 6.
- Page 23 and 24:
XXIIAna!Jtical Table of ContentsA.
- Page 25 and 26:
xxivAnalytical Table of Contents§
- Page 27 and 28:
111/rotltiGtiollThe second part of
- Page 30 and 31:
CHAPTER 1PRELIMINARY REMARKS§ I. T
- Page 32 and 33:
Chap. 1 PreliJl/inary RIll/arks 7Ie
- Page 34 and 35:
Chap. I Preliminary Remarks 9It has
- Page 36 and 37:
Chap. I Preliminary Remarle.s IIA f
- Page 38 and 39:
Chap. IPreliminary Remar!eJNaturall
- Page 40 and 41:
Chap-, 2 The PurelY Monetary Theory
- Page 42 and 43:
Chap. 2.The PurelY Monetary Theoryp
- Page 44 and 45:
Chap. 2.The PurelY Monetary Theoryp
- Page 46 and 47:
Chap. z The PurelY Monetary Theory
- Page 48 and 49:
Chap. 2.The PurelY Monetary Theoryi
- Page 50 and 51:
Chap. 2The PurelY Monetary Theoryco
- Page 52 and 53:
Chap. 2The PI/relY Monetary Theorya
- Page 54 and 55:
CHAPTER 3THE OVER-INVESTMENT THEORI
- Page 56 and 57:
Chap. 3The Over-investment Theories
- Page 58 and 59:
Chap. ;The Over-investment Theories
- Page 60 and 61:
Chap. 3 The Over-investment Theorie
- Page 62 and 63:
Chap. 3 The Over-investment Theorie
- Page 64 and 65:
Chap. 3 The Over-investment Theorie
- Page 66 and 67:
Chap~ 3 The Over-investment Theorie
- Page 68 and 69:
Chap. 3 The Over-investment Theorie
- Page 70 and 71:
Chap. 3 The Over-investment Theorie
- Page 72 and 73:
Chap. 3 The Over-investment Theorie
- Page 74 and 75:
Chap. 3 The Over-investment Theorie
- Page 76 and 77:
Chap. ; The Over-:-im;estment Theor
- Page 78 and 79:
Chap. 3 The Over-jf/Pestment Theori
- Page 80 and 81:
Chap. 3 The Over-investment Theorie
- Page 82 and 83:
Chap. 3 The Over-investment Theorie
- Page 84 and 85:
Chap. 3 The Over-investment Theorie
- Page 86 and 87:
Chap. 3 The Over-investment Theorie
- Page 88 and 89:
Chap. 3The Over-inve.Jtment Theoric
- Page 90 and 91:
Chap. 3The Over-investment Theories
- Page 92 and 93:
Chap. 3The· Over-investlnent Theor
- Page 94 and 95:
Chap. ;The Over-investment Theories
- Page 96 and 97:
Chap. 3 T h~·· Over-investment Th
- Page 98 and 99:
Chap. 3 The Over-investment Theorie
- Page 100 and 101:
Chap. 3 The Over-investment Theorie
- Page 102 and 103:
Chap. 3 The Over-investment Theorie
- Page 104 and 105:
Chap. 3 The Over-i1l1Jesfmenf Theor
- Page 106 and 107:
Chap. 3 The Over-investment Theorie
- Page 108 and 109:
Chap. ;The Over-investment Theories
- Page 110 and 111:
Chap. 3The Over-investment Theories
- Page 112 and 113:
Chap. 3The Over-investment Theories
- Page 114 and 115:
Chap. 3The Over-int 1 estment Theor
- Page 116 and 117:
Chap. 3The Over-investment Theories
- Page 118 and 119:
Chap~ 3 The Over-investment Theorie
- Page 120 and 121:
Chap. 3 The Over-investment Theorie
- Page 122 and 123:
Chap. 3 The Over-investment Theorie
- Page 124 and 125:
Chap. 3 The O'IJer-investment Theor
- Page 126 and 127:
Chap. 3 The Over-illtJ6slmmt Theori
- Page 128 and 129:
Chap. 3The Over-investment Theories
- Page 130 and 131:
Chap. 3 The Over-investment Theorie
- Page 132 and 133:
Chap. 4 Changes in Cost as Cause of
- Page 134 and 135:
Chap. 4Changes in Cost as Cause of
- Page 136 and 137:
Chap. 4 Changes in Efficiency as Ca
- Page 138 and 139:
Chap. 4 Error Theories 113cars is d
- Page 140 and 141:
Chap. 4 The Debt-Deflation Theory l
- Page 142 and 143:
Chap. 4 Filkllldal Strwtllrl and th
- Page 144 and 145:
Chap. ,Under-consumption TheorilsIt
- Page 146 and 147:
Chap. S Under-conJllflJption Theori
- Page 148 and 149:
Chap. , Under-consumption Theories
- Page 150 and 151:
Chap. 5 UnJer-con.r1l111ptiOIl T!Ho
- Page 152 and 153:
Chap. 5 Under-consumption Theories
- Page 154 and 155:
Chap. ~(( top " ofthe structure ofp
- Page 156 and 157:
Chap. 5Under-consumption TheoriesTh
- Page 158 and 159:
Chap. S 133maladjustment or an insu
- Page 160 and 161: Chap. SUnder-consumption Theoriesth
- Page 162 and 163: Chap. , Ullder-COll~rIl1lJption 11J
- Page 164 and 165: Chap. 5Under-consumption TheoriesTh
- Page 166 and 167: Clap. ~Under-mullfIJption Theoriesc
- Page 168 and 169: Chap. 6 U Psych%gica/ Theories" 143
- Page 170 and 171: Chap. 6With the introduction of the
- Page 172 and 173: Chap. 6 CC Pfych%gi&aJ TheorieJ " 1
- Page 174 and 175: Chap. 6 149their own moneyJ the rep
- Page 176 and 177: CHAPTER 7HARVEST THEORIES.AGRICULTU
- Page 178 and 179: Chap. 7 Agri~Nihire and the Btisine
- Page 180 and 181: Chap. 7Agriculture and the Business
- Page 182 and 183: Chap. 7Agrie-IIJtNre and the BIIJi"
- Page 184 and 185: Chap. 7Ag,.kuJture and the Business
- Page 186 and 187: Chap. 7 161It is important to consi
- Page 188 and 189: Chap. 7A
- Page 190 and 191: Chap. 7AgriclJlture and the Busines
- Page 192 and 193: Chap. 7Agriculture aIIti the BlIJin
- Page 194 and 195: Chap. 8Recent Discussions on the Tr
- Page 196 and 197: Chap. 8 Recent Discussions on the T
- Page 198 and 199: Chap. 8 Recent Discussions on the T
- Page 200 and 201: Chap. 8Recent Discussions on the Tr
- Page 202 and 203: Chap. 8 Recent Discussions on the T
- Page 204 and 205: Chap. 8 Recent DiscUJsion.! on the
- Page 206 and 207: Chap. 8 Reant DisCll.fsions on the
- Page 208 and 209: Chap. 8Recent Discussions on the Tr
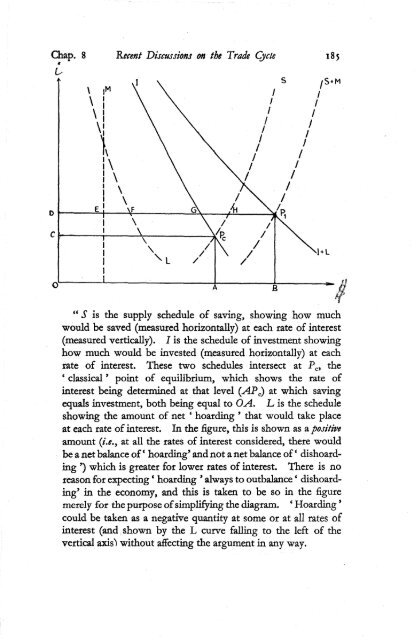
- Page 212 and 213: Chap. 8Recent Discussions on the Tr
- Page 214 and 215: ,Chap. 8 '&Bcent Discussions on the
- Page 216 and 217: Chap. 8Recent Discussions on the Tr
- Page 218 and 219: Chap. 8Recent Discussions on .the T
- Page 220 and 221: Chap. 8Recent Discussions on the Tr
- Page 222 and 223: Chap. 8 Recent DisCIISsion.s on the
- Page 224 and 225: Chap. 8 Recent Discussions on the T
- Page 226 and 227: Chap. 8 Recent Discussions on the T
- Page 228 and 229: Chap. 8 Recent Discussions on the T
- Page 230 and 231: Chap. 8 Recent Discussions on the T
- Page 232 and 233: Chap. 8Recent Discussions on the Tr
- Page 234 and 235: Chap. 8Recent Discussions on the Tr
- Page 236 and 237: Chap. 8 Recent Discussions on the T
- Page 238 and 239: Chap. 8 Recent Di~rcussions on the
- Page 240 and 241: Chap. 8 H.ece/it DiJcussiofu on the
- Page 242 and 243: Chap. 8 Recent Discussions on the T
- Page 244 and 245: Chap. 8Recent Discussion.! on the T
- Page 246 and 247: Chap. 8 'Recent Discussions on· th
- Page 248 and 249: Chap. 8Recent Discussions on the Tr
- Page 250 and 251: Chap. 8 Recent Discussions on the T
- Page 252 and 253: Chap. 8Recent Discussions on the Tr
- Page 254 and 255: Chap. 8 Recent Di.rcuJ.rionJ fJn th
- Page 256 and 257: Chap. 8Recent Discussions on the .T
- Page 258 and 259: Chap. 8Recent Discussions on the Tr
- Page 260 and 261:
Chap. 8Recent Discussions on the Tr
- Page 262 and 263:
Chap. 8Recent Discussions on the Tr
- Page 264 and 265:
Chap. 8Recent Discussions on the Tr
- Page 266 and 267:
Chap. 8Recent Discussions on the Tr
- Page 268 and 269:
Chap. 8Recent Discussions on the Tr
- Page 270 and 271:
Chap. 8Recent Discussions on the Tr
- Page 272 and 273:
Chap. 8 Recent DisCllJsions on the
- Page 274 and 275:
Clap. 8 ReGent DisfllJsions on the
- Page 276 and 277:
Chap. 8Recent Di.scusJions on the T
- Page 278 and 279:
Chap. 8R.e&lIIt DisaunOlU 011 the T
- Page 280:
Part IISYNTHETIC EXPOSITION RELATIN
- Page 283 and 284:
Nature and Causes of the 0(1,Part I
- Page 285 and 286:
160 Nature and Causes of the CycleP
- Page 287 and 288:
%6z Nahlre IlIId CtlIISes of the Cy
- Page 289 and 290:
Nature and Catlses 0./ the CyclePar
- Page 291 and 292:
2.66 Nature and ~auses of the Cycle
- Page 293 and 294:
2.68 Nature and Causes of the Cycle
- Page 295 and 296:
Nat., and CaNses of the CyclePart n
- Page 297 and 298:
Nature and. Causes of the CyclePart
- Page 299 and 300:
274 Nature and Causes· oj" the Cyc
- Page 301 and 302:
Nature.· and Causes· of the Cycle
- Page 303 and 304:
NaJr, and Casls of the ey,,,Part II
- Page 305 and 306:
180 Nature and Causes oj" the Cycle
- Page 307 and 308:
Nature and Causes of the CyclePart
- Page 309 and 310:
Na/Nrc and Causes of the CyclePart
- Page 311 and 312:
286 NatNr' and CalIS's· of the 01'
- Page 313 and 314:
288 Nature and Causes of the Cycle
- Page 315 and 316:
Nature and Causes of the CyclePart
- Page 317 and 318:
Nature and Causes of the CyclePart
- Page 319 and 320:
Nature and Causes of the CyclePart
- Page 321 and 322:
Nature and Causes of the C;YclePart
- Page 323 and 324:
Nature and Causes of the CyclePart
- Page 325 and 326:
3 00 Nature and Causes of t~ Cycle
- Page 327 and 328:
Nature andCause.r of the CyclePart
- Page 329 and 330:
Nature and Causes of' the CyclePart
- Page 331 and 332:
Nature and Causes of the CyclePart
- Page 333 and 334:
Nature and CaUSdS of the CyclePart
- Page 335 and 336:
~IO Nature and CauJes oj the CYfl,
- Page 337 and 338:
Nature and CauJeJ of the CyclePart
- Page 339 and 340:
Nature and Causes of the CyclePart
- Page 341 and 342:
Nature d11d Causes. of the CyclePar
- Page 343 and 344:
Natllre and Causes of the CyclePart
- Page 345 and 346:
N atnre and Causes of the ,CyclePar
- Page 347 and 348:
Nature and Causes of the CyclePart
- Page 349 and 350:
Nature and Causes of the CyclePart
- Page 351 and 352:
Nature and Causes of the CyclePart
- Page 353 and 354:
Nature and Causes of the CyclePart
- Page 355 and 356:
Nature and Causes of the CyclePart
- Page 357 and 358:
Nature and Callses 0./ the CyclePar
- Page 359 and 360:
334 Nature and' Causes of the Cycle
- Page 361 and 362:
Nature and Causes of the CyclePart
- Page 363 and 364:
;;8 Nature and Causes of the Cycle
- Page 365 and 366:
34° Nature and Causes of the Cycle
- Page 367 and 368:
Nature and Cau.re.r ~f the Cycle Pa
- Page 369 and 370:
344 Natllre and Callses of the Cycl
- Page 371 and 372:
Nature and Causes oj. the CyclePart
- Page 373 and 374:
Nature and Causes of the CyclePart
- Page 375 and 376:
Nature and Causes of tht Cycl'Part
- Page 377 and 378:
Nature and Causes of the CyclePart
- Page 379 and 380:
354 Nature and Causes of the Cycle
- Page 381 and 382:
Nature and Causes of the CyclePart
- Page 383 and 384:
Nature and Causes of the CyclePart
- Page 385 and 386:
Nature and Causes of the CyclePart
- Page 387 and 388:
Nature and Causes of the CyclePart
- Page 389 and 390:
Nature and Causes of the CyclePart
- Page 391 and 392:
Nature and Causes of the CyclePart
- Page 393 and 394:
Nature and· Causes of the CyclePar
- Page 395 and 396:
Nature and Causes of the CyclePart
- Page 397 and 398:
Nature and Causes of the CyclePart
- Page 399 and 400:
374 Nature and Causes of the Cycle
- Page 401 and 402:
Nature and Causes of the CyclePart
- Page 403 and 404:
Nature and Causes of the CyclePart
- Page 405 and 406:
Nature and Causes of the CyclePart
- Page 407 and 408:
Nature and Causes of the CyclePart
- Page 409 and 410:
Nature and Causes of the CyclePart
- Page 411 and 412:
Nature and Causes of the CyclePart
- Page 413 and 414:
Nature and Callses of the C:JclePar
- Page 415 and 416:
Nature and Causes of the OclePart I
- Page 417 and 418:
392 Natllre and Causes of the Cycle
- Page 419 and 420:
394 Nature and Causes of the 0c1e P
- Page 421 and 422:
Nature and Causes of the CyclePart
- Page 423 and 424:
Nature and Causes of the CyclePart
- Page 425 and 426:
400 Nature and Causes of the Cycle
- Page 427 and 428:
4°2. Nature and Causes of the Cycl
- Page 429 and 430:
Nature and Causes of the CyclePart
- Page 431 and 432:
CHAPTER 12INTERNATIONAL ASPECTS OF
- Page 433 and 434:
Nature and CatlSes of the CyclePart
- Page 435 and 436:
410 Nature and Causes 0.1 the Cycle
- Page 437 and 438:
4 1 2. Nattire and Causes of the Cy
- Page 439 and 440:
Nature and Causes of the CyclePart
- Page 441 and 442:
Nature and Causes of the CyclePart
- Page 443 and 444:
418 Nature and Causes of the C;ycle
- Page 445 and 446:
42.0 Nature and Causes of the Cycle
- Page 447 and 448:
42.2. Nature and .Causes of the Cyc
- Page 449 and 450:
Nature and Causes of the CyclePart
- Page 451 and 452:
Nature and Causes ~I the Cycle Part
- Page 453 and 454:
Nature and Callses of the CyclePart
- Page 455 and 456:
43° Nature and Causes of the Cycle
- Page 457 and 458:
o • ANature and CalISe.! of the C
- Page 459 and 460:
434 Nature and Causes of the Cycle
- Page 461 and 462:
Nattire and Causes of the C:JclePar
- Page 463 and 464:
Nature and Causes of the CyclePart
- Page 465 and 466:
440 Nature and Causes of the Cycle
- Page 467 and 468:
442. Nature and Causes of the Cycle
- Page 469 and 470:
444 Nature and Causes of the Cycle
- Page 471 and 472:
Nature and Causes of the CyclePart
- Page 473 and 474:
Nature and Causes of the CyclePart
- Page 475 and 476:
Nature and Causes qf'the CyclePart
- Page 478:
Part IIIFURTHER REFLECTIONS ON RECE
- Page 481 and 482:
Recent Developments in Trade Cycle
- Page 483 and 484:
Recent Developments in Trade Cycle
- Page 485 and 486:
Recent Dell,Jopm,ntI in TraJ, eycJ,
- Page 487 and 488:
Recent Develop"lents in Trade Cycle
- Page 489 and 490:
Recent Developments in Trade Cycle
- Page 491 and 492:
Recent Developments in Trade Cycle
- Page 493 and 494:
Recent Developmenti in Trade Cycle
- Page 495 and 496:
47° Recent Developments in Trade C
- Page 497 and 498:
47 2 Recent Developments in Trade C
- Page 499 and 500:
474 Recent Developments in Trade Cy
- Page 501 and 502:
Recent Developments in Trade Cycle
- Page 503 and 504:
Recent Developments in Trade Cycle
- Page 505 and 506:
Recent Developments in Trade Cycle
- Page 507 and 508:
Recent Developments in Trade Cycle
- Page 509 and 510:
Recent Developments in Trade Cycle
- Page 511 and 512:
Recent Developments in, Trade Cycle
- Page 513 and 514:
Recent Developments in Trade Cycle
- Page 515 and 516:
49° Recent Developments in Trade C
- Page 517 and 518:
49 2 Recent Developments in Trade C
- Page 519 and 520:
494 Recent Developments in Trade Cy
- Page 521 and 522:
Recent Developments in Trade Cycle
- Page 523 and 524:
Recent Developments in Trade Cycle
- Page 525 and 526:
soo Recent Developlllel1ts in Trade
- Page 527 and 528:
502 Recent Developments in Trade Cy
- Page 529 and 530:
Recent Developments in Trade Cycle
- Page 531 and 532:
506 Recent Developments in Trade Cy
- Page 534 and 535:
Appendix IDESCRIPTION OF THE INDICE
- Page 536 and 537:
Appendix I 5 11Employment.1911- 193
- Page 538 and 539:
Appendix IIB. Number of workpeople
- Page 540 and 541:
NAME INDEX TO PARTS I AND IIAdams,
- Page 542 and 543:
Name Index to Parts I and IIKeynes
- Page 544 and 545:
SUB}EC1' INDEX TO PARTS I AND IIAcc
- Page 546 and 547:
Subject Index to Parts I and II 5 2
- Page 548 and 549:
.. Subject Index to Parts I and IIB
- Page 550 and 551:
Subject Index 10 Paris I and IIInve
- Page 552 and 553:
Subject Index to Parts I and IIProd
- Page 554 and 555:
Subject Index to Parts I and IIWage
- Page 556 and 557:
Name and Subject Index to Part IIIK


