$11.1 billion in 2005 compared with $7.8 billion in 2004 (table 2-1, figure 2-1). Notably,U.S. fuel-related trade with ATPA countries (HTS chapter 27) accounted for over four-fifths<strong>of</strong> this deficit in 2005.U.S. Imports from ATPA CountriesIn 2005, ATPA countries collectively were <strong>the</strong> 17 th largest supplier <strong>of</strong> U.S. imports (in 2004<strong>the</strong>y ranked 22 nd ), larger than Thailand, but smaller than Nigeria. <strong>The</strong> United Statescontinued to be <strong>the</strong> leading destination <strong>of</strong> each ATPA country’s exports, except Bolivia’s.U.S. imports from ATPA countries consist primarily <strong>of</strong> raw materials and <strong>the</strong>ir derivatives,agricultural and horticultural products, seafood, and apparel.Table 2-2 shows <strong>the</strong> composition <strong>of</strong> total U.S. imports from ATPA countries by major HTSproduct categories during 2001-2005. Product groups that include natural resources andderivatives dominate this list. Mineral fuels and oils (HTS chapter 27)—specificallypetroleum and coal—have accounted for at least 40 percent <strong>of</strong> <strong>the</strong> total in <strong>the</strong> last five years.This share exceeded 50 percent in 2005, mainly because <strong>of</strong> an increase in <strong>the</strong> price <strong>of</strong> <strong>the</strong>seproducts. HTS chapter 71, which consisted mostly <strong>of</strong> gold bullion but also included preciousstones, metals, and jewelry, ranked second in both 2004 and 2005. This group accounted forsome 12 percent <strong>of</strong> <strong>the</strong> total in both 2004 and 2005. Knitted apparel, which rose to <strong>the</strong> thirdlargestcategory in U.S. imports from ATPA countries in 2003, continued to rank third in2005, accounting for close to 5 percent <strong>of</strong> <strong>the</strong> total.Table 2-3 lists <strong>the</strong> 20 leading U.S. imports from ATPA countries during 2005 on an 8-digitHTS subheading basis, ranked by <strong>the</strong>ir 2005 import value. Since October 31, 2002, whenATPDEA entered into effect, all <strong>of</strong> <strong>the</strong>se products from ATPA countries have been eligiblefor duty-free entry under ATPA or GSP, or at NTR duty rates. 54 Products that have NTRduty rates <strong>of</strong> free include many traditional imports from ATPA countries: gold bullion,c<strong>of</strong>fee, coal, bananas, shrimp, 55 and unalloyed tin. Most U.S. imports <strong>of</strong> <strong>the</strong> 20 items listedin table 2-3 increased in value in 2005.Several leading imports shown in table 2-3 also appear as leading imports under ATPA andwill be discussed later in this chapter.Duty Treatment<strong>The</strong> dutiable share <strong>of</strong> total U.S. imports from ATPA countries continued to decline in2005, mirroring <strong>the</strong> increase in <strong>the</strong> portion <strong>of</strong> U.S. imports from ATPA countries enteringunder ATPDEA. This dutiable share fell from 14.0 percent in 2003, using adjusted data,54 GSP applies to only one item (cut flowers) among <strong>the</strong> 20 leading products.55However, on Jan. 21, 2005, <strong>the</strong> Commission determined that an industry in <strong>the</strong> United States ismaterially injured by reason <strong>of</strong> imports <strong>of</strong> certain frozen or canned warm-water shrimp from Ecuador, amongo<strong>the</strong>r countries. An antidumping duty order on imports from Ecuador became effective on Feb. 1, 2005 (70F.R. 5156, Feb. 1, 2005).2-2
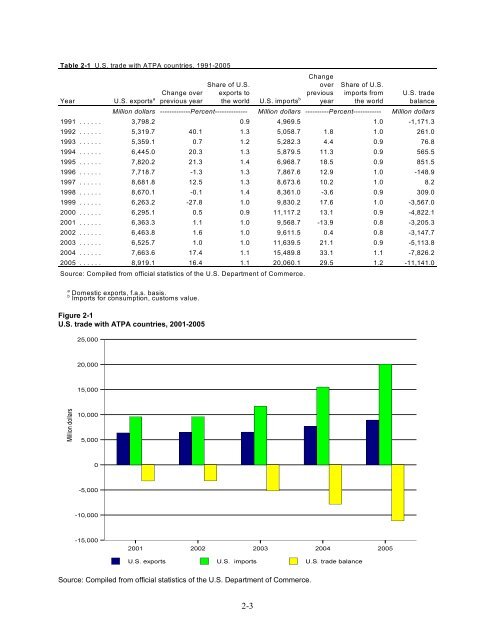
Table 2-1 U.S. trade with ATPA countries, 1991-2005Year U.S. exports a previous yearChange overShare <strong>of</strong> U.S.exports to<strong>the</strong> world U.S. imports b ChangeoverpreviousyearShare <strong>of</strong> U.S.imports from<strong>the</strong> worldU.S. tradebalanceMillion dollars -------------Percent-------------- Million dollars ----------Percent------------ Million dollars1991 ...... 3,798.2 0.9 4,969.5 1.0 -1,171.31992 ...... 5,319.7 40.1 1.3 5,058.7 1.8 1.0 261.01993 ...... 5,359.1 0.7 1.2 5,282.3 4.4 0.9 76.81994 ...... 6,445.0 20.3 1.3 5,879.5 11.3 0.9 565.51995 ...... 7,820.2 21.3 1.4 6,968.7 18.5 0.9 851.51996 ...... 7,718.7 -1.3 1.3 7,867.6 12.9 1.0 -148.91997 ...... 8,681.8 12.5 1.3 8,673.6 10.2 1.0 8.21998 ...... 8,670.1 -0.1 1.4 8,361.0 -3.6 0.9 309.01999 ...... 6,263.2 -27.8 1.0 9,830.2 17.6 1.0 -3,567.02000 ...... 6,295.1 0.5 0.9 11,117.2 13.1 0.9 -4,822.12001 ...... 6,363.3 1.1 1.0 9,568.7 -13.9 0.8 -3,205.32002 ...... 6,463.8 1.6 1.0 9,611.5 0.4 0.8 -3,147.72003 ...... 6,525.7 1.0 1.0 11,639.5 21.1 0.9 -5,113.82004 ...... 7,663.6 17.4 1.1 15,489.8 33.1 1.1 -7,826.22005 ...... 8,919.1 16.4 1.1 20,060.1 29.5 1.2 -11,141.0Source: Compiled from <strong>of</strong>ficial statistics <strong>of</strong> <strong>the</strong> U.S. Department <strong>of</strong> Commerce.abDomestic exports, f.a.s. basis.Imports for consumption, customs value.Figure 2-1U.S. trade with ATPA countries, 2001-2005Source: Compiled from <strong>of</strong>ficial statistics <strong>of</strong> <strong>the</strong> U.S. Department <strong>of</strong> Commerce.2-3