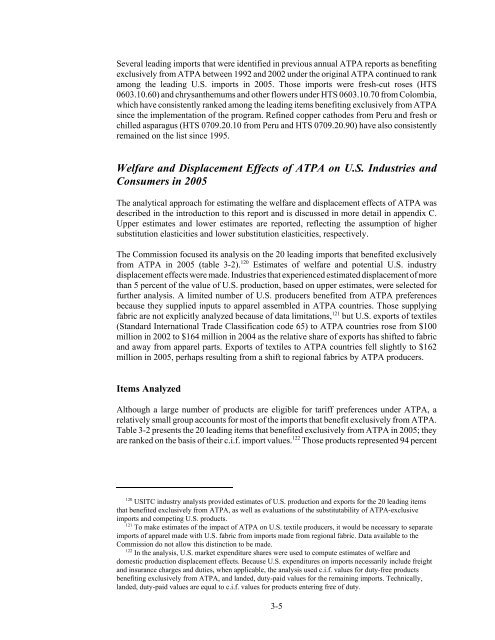
Table 3-2 Leading imports that benefited exclusively from ATPA, 2005(1,000 dollars)HTSprovision DescriptionCustomsvalueC.i.f.value2709.00.10 Petroleum oils and oils from bituminous minerals, crude, testing under 25degrees A.P.I. ............................................... 5,182,127 5,488,2962709.00.20 Petroleum oils and oils from bituminous minerals, crude, testing 25 degreesA.P.I. or more ................................................ 1,770,339 1,827,7912710.19.05 Distillate and residual fuel oil (including blends) derived from petroleum or oilsfrom bituminous minerals, testing under 25 degrees A.P.I. ............. 541,470 573,8977403.11.00 a Refined copper cathodes and sections <strong>of</strong> cathodes ...................... 556,350 564,6352710.11.25 Naphthas (exc. motor fuel/mtr fuel blend. stock) fr petroleum oils & bituminminerals (o/than crude) or preps 70%+ by wt. fr petroleum oils .......... 406,173 429,3800603.10.60 Roses, fresh cut ................................................. 263,076 335,4946110.20.20 Sweaters, pullovers and similar articles, knitted or crocheted, <strong>of</strong> cotton,n.e.s.o.i. ....................................................... 295,156 308,0446105.10.00 Men's or boys' shirts, knitted or crocheted, <strong>of</strong> cotton ..................... 193,835 200,1366109.10.00 T-shirts, singlets, tank tops and similar garments, knitted or crocheted, <strong>of</strong>cotton ...................................................... 164,190 172,0766203.42.40 Men's or boys' trousers and shorts, not bibs, not knitted or crocheted, <strong>of</strong>cotton, not containing 15% or more by weight <strong>of</strong> down, etc ............. 156,388 159,3250709.20.90 Asparagus, n.e.s.o.i., fresh or chilled ................................. 87,130 140,1650603.10.70 b Chrysan<strong>the</strong>mums, standard carnations, anthuriums and orchids, fresh cut .... 96,287 124,4036106.10.00 Women's or girls' blouses and shirts, knitted or crocheted, <strong>of</strong> cotton ......... 64,213 66,4846204.62.40 Women's or girls' trousers, breeches and shorts, not knitted or crocheted, <strong>of</strong>cotton, n.e.s.o.i. ................................................. 55,793 57,1260603.10.80 c Cut flowers and flower buds suitable for bouquets or ornamental purposes,fresh cut, n.e.s.o.i. ............................................ 43,556 55,6481604.14.30 Tunas and skipjack, not in oil, in airtight containers, n.e.s.o.i. .............. 47,814 49,0772710.19.15 Kerosene-type jet fuel from petroleum oils and oils <strong>of</strong> bitumin minerals(o/than crude) or preps. 70%+ by wt. from petroleum oils .............. 39,843 41,3040709.20.10 a Asparagus, fresh or chilled, not reduced in size, if entered September 15to November 15, inclusive, and transported to <strong>the</strong> U.S. by air ........... 23,548 40,3022402.20.80 Cigarettes containing tobacco but not containing clove, paper-wrapped ...... 39,097 39,9986908.90.00 Glazed ceramic flags and paving, hearth or wall tiles; glazed ceramicmosaic cubes and <strong>the</strong> like, n.e.s.o.i. .............................. 19,424 26,473Source: Estimated by <strong>the</strong> U.S. International <strong>Trade</strong> Commission from <strong>of</strong>ficial statistics <strong>of</strong> <strong>the</strong> U.S. Department <strong>of</strong>Commerce.Note: <strong>The</strong> abbreviation n.e.s.o.i. stands for “not elsewhere specified or o<strong>the</strong>rwise included.”a Includes only imports from Peru. Item is GSP-eligible, but imports from Peru exceeded <strong>the</strong> competitive need limitand thus were eligible for duty-free entry only under ATPA.b Includes only imports from Colombia. Item is GSP-eligible, but imports from Colombia exceeded <strong>the</strong> competitiveneed limit and thus were eligible for duty-free entry only under ATPA.c Includes only imports from Colombia for <strong>the</strong> second half <strong>of</strong> 2005. Item is GSP-eligible, but imports fromColombia exceeded competitive need limit and thus were eligible for duty-free entry only under ATPA in <strong>the</strong> secondhalf <strong>of</strong> <strong>the</strong> year.6203.42.40), up $59 million (61 percent). Increases in <strong>the</strong> value <strong>of</strong> petroleum and petroleumproducts and copper cathodes reflect substantial increases in unit values, and for mostproducts (including <strong>the</strong> petroleum and petroleum products mentioned above, but not coppercathodes), substantial increases in <strong>the</strong> volume <strong>of</strong> imports. Two products were added to <strong>the</strong>list <strong>of</strong> 20 leading imports benefiting exclusively from ATPA in 2005—o<strong>the</strong>r fresh-cutflowers (HTS 0603.10.80) and kerosene-type jet fuel (HTS 2710.19.15). As shown inchapter 2, 17 <strong>of</strong> <strong>the</strong> 20 leading imports benefiting exclusively in 2005 were among <strong>the</strong> 20leading imports under ATPA in 2005 (see table 2-7).3-4
Several leading imports that were identified in previous annual ATPA reports as benefitingexclusively from ATPA between 1992 and 2002 under <strong>the</strong> original ATPA continued to rankamong <strong>the</strong> leading U.S. imports in 2005. Those imports were fresh-cut roses (HTS0603.10.60) and chrysan<strong>the</strong>mums and o<strong>the</strong>r flowers under HTS 0603.10.70 from Colombia,which have consistently ranked among <strong>the</strong> leading items benefiting exclusively from ATPAsince <strong>the</strong> implementation <strong>of</strong> <strong>the</strong> program. Refined copper cathodes from Peru and fresh orchilled asparagus (HTS 0709.20.10 from Peru and HTS 0709.20.90) have also consistentlyremained on <strong>the</strong> list since 1995.Welfare and Displacement Effects <strong>of</strong> ATPA on U.S. Industries andConsumers in 2005<strong>The</strong> analytical approach for estimating <strong>the</strong> welfare and displacement effects <strong>of</strong> ATPA wasdescribed in <strong>the</strong> introduction to this report and is discussed in more detail in appendix C.Upper estimates and lower estimates are reported, reflecting <strong>the</strong> assumption <strong>of</strong> highersubstitution elasticities and lower substitution elasticities, respectively.<strong>The</strong> Commission focused its analysis on <strong>the</strong> 20 leading imports that benefited exclusivelyfrom ATPA in 2005 (table 3-2). 120 Estimates <strong>of</strong> welfare and potential U.S. industrydisplacement effects were made. Industries that experienced estimated displacement <strong>of</strong> morethan 5 percent <strong>of</strong> <strong>the</strong> value <strong>of</strong> U.S. production, based on upper estimates, were selected forfur<strong>the</strong>r analysis. A limited number <strong>of</strong> U.S. producers benefited from ATPA preferencesbecause <strong>the</strong>y supplied inputs to apparel assembled in ATPA countries. Those supplyingfabric are not explicitly analyzed because <strong>of</strong> data limitations, 121 but U.S. exports <strong>of</strong> textiles(Standard International <strong>Trade</strong> Classification code 65) to ATPA countries rose from $100million in 2002 to $164 million in 2004 as <strong>the</strong> relative share <strong>of</strong> exports has shifted to fabricand away from apparel parts. Exports <strong>of</strong> textiles to ATPA countries fell slightly to $162million in 2005, perhaps resulting from a shift to regional fabrics by ATPA producers.Items AnalyzedAlthough a large number <strong>of</strong> products are eligible for tariff preferences under ATPA, arelatively small group accounts for most <strong>of</strong> <strong>the</strong> imports that benefit exclusively from ATPA.Table 3-2 presents <strong>the</strong> 20 leading items that benefited exclusively from ATPA in 2005; <strong>the</strong>yare ranked on <strong>the</strong> basis <strong>of</strong> <strong>the</strong>ir c.i.f. import values. 122 Those products represented 94 percent120<strong>USITC</strong> industry analysts provided estimates <strong>of</strong> U.S. production and exports for <strong>the</strong> 20 leading itemsthat benefited exclusively from ATPA, as well as evaluations <strong>of</strong> <strong>the</strong> substitutability <strong>of</strong> ATPA-exclusiveimports and competing U.S. products.121 To make estimates <strong>of</strong> <strong>the</strong> impact <strong>of</strong> ATPA on U.S. textile producers, it would be necessary to separateimports <strong>of</strong> apparel made with U.S. fabric from imports made from regional fabric. Data available to <strong>the</strong>Commission do not allow this distinction to be made.122 In <strong>the</strong> analysis, U.S. market expenditure shares were used to compute estimates <strong>of</strong> welfare anddomestic production displacement effects. Because U.S. expenditures on imports necessarily include freightand insurance charges and duties, when applicable, <strong>the</strong> analysis used c.i.f. values for duty-free productsbenefiting exclusively from ATPA, and landed, duty-paid values for <strong>the</strong> remaining imports. Technically,landed, duty-paid values are equal to c.i.f. values for products entering free <strong>of</strong> duty.3-5