2-10Table 2-6 Leading U.S. imports for consumption under ATPA, by major product categories, 2001-2005HTSchapter Description 2001 2002 a 2003 a 2004 a 2005 aValue (1,000 dollars)27 Mineral fuels, mineral oils and products <strong>of</strong> <strong>the</strong>ir distillation; bituminous substances; mineral waxes . . 0 209,969 3,405,798 5,306,647 7,951,84761 Articles <strong>of</strong> apparel and clothing accessories, knitted or crocheted ........................... 54 0 573,018 858,335 953,60574 Copper and articles <strong>the</strong>re<strong>of</strong> ......................................................... 440,307 253,781 464,096 446,273 587,49606 Live trees and o<strong>the</strong>r plants; bulbs, roots and <strong>the</strong> like; cut flowers and ornamental foliage ......... 382,689 172,925 451,172 551,629 549,69762 Articles <strong>of</strong> apparel and clothing accessories, not knitted or crocheted ........................ 1,202 191 184,767 297,788 364,69107 Edible vegetables and certain roots and tubers .......................................... 78,107 71,545 123,324 152,864 179,88671 Natural or cultured pearls, precious or semiprecious stones, precious metals; precious metalclad metals, articles <strong>the</strong>re<strong>of</strong>; imitation jewelry; coin .................................... 152,661 77,584 123,817 158,437 168,05739 Plastics and articles <strong>the</strong>re<strong>of</strong> ......................................................... 44,225 13,226 29,831 46,140 93,33420 Preparations <strong>of</strong> vegetables, fruit, nuts, or o<strong>the</strong>r parts <strong>of</strong> plants .............................. 30,576 15,832 37,840 54,433 80,44316 Edible preparations <strong>of</strong> meat, fish, crustaceans, molluscs or o<strong>the</strong>r aquatic invertebrates .......... 29,690 4,540 47,395 56,259 70,667Subtotal ...................................................................... 1,159,513 819,592 5,441,058 7,928,805 10,999,723All o<strong>the</strong>r ........................................................................ 515,094 181,223 394,973 430,453 464,226Total ........................................................................ 1,674,607 1,000,816 5,836,032 8,359,258 11,463,949Percent <strong>of</strong> total27 Mineral fuels, mineral oils and products <strong>of</strong> <strong>the</strong>ir distillation; bituminous substances; mineral waxes . . 0.0 21.0 58.4 63.5 69.461 Articles <strong>of</strong> apparel and clothing accessories, knitted or crocheted ........................... ( b ) 0.0 9.8 10.3 8.374 Copper and articles <strong>the</strong>re<strong>of</strong> ......................................................... 26.3 25.4 8.0 5.3 5.106 Live trees and o<strong>the</strong>r plants; bulbs, roots and <strong>the</strong> like; cut flowers and ornamental foliage ......... 22.9 17.3 7.7 6.6 4.862 Articles <strong>of</strong> apparel and clothing accessories, not knitted or crocheted ........................ 0.1 ( b ) 3.2 3.6 3.207 Edible vegetables and certain roots and tubers .......................................... 4.7 7.1 2.1 1.8 1.671 Natural or cultured pearls, precious or semiprecious stones, precious metals; precious metalclad metals, articles <strong>the</strong>re<strong>of</strong>; imitation jewelry; coin .................................... 9.1 7.8 2.1 1.9 1.539 Plastics and articles <strong>the</strong>re<strong>of</strong> ......................................................... 2.6 1.3 0.5 0.6 0.820 Preparations <strong>of</strong> vegetables, fruit, nuts, or o<strong>the</strong>r parts <strong>of</strong> plants .............................. 1.8 1.6 0.6 0.7 0.716 Edible preparations <strong>of</strong> meat, fish, crustaceans, molluscs or o<strong>the</strong>r aquatic invertebrates .......... 1.8 0.5 0.8 0.7 0.6Subtotal ...................................................................... 69.2 81.9 93.2 94.9 96.0All o<strong>the</strong>r ........................................................................ 30.8 18.1 6.8 5.1 4.0Total ........................................................................ 100.0 100.0 100.0 100.0 100.0Source: Compiled from <strong>of</strong>ficial statistics <strong>of</strong> <strong>the</strong> U.S. Department <strong>of</strong> Commerce.Note: Because <strong>of</strong> rounding, figures may not add to totals shown.a ATPA includes imports under ATPDEA.b Less than 0.05 percent.
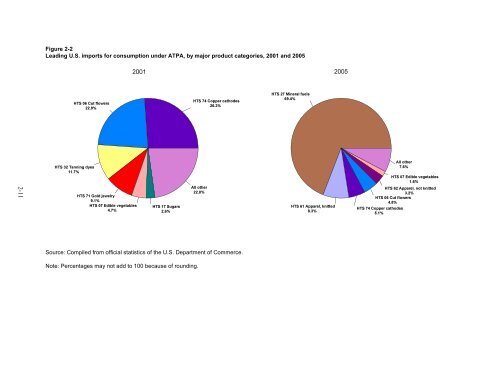
Figure 2-2Leading U.S. imports for consumption under ATPA, by major product categories, 2001 and 2005Source: Compiled from <strong>of</strong>ficial statistics <strong>of</strong> <strong>the</strong> U.S. Department <strong>of</strong> Commerce.Note: Percentages may not add to 100 because <strong>of</strong> rounding.