

The Impact of the Andean Trade Preference Act Twelfth ... - USITC
The Impact of the Andean Trade Preference Act Twelfth ... - USITC
The Impact of the Andean Trade Preference Act Twelfth ... - USITC
- No tags were found...

You also want an ePaper? Increase the reach of your titles
YUMPU automatically turns print PDFs into web optimized ePapers that Google loves.
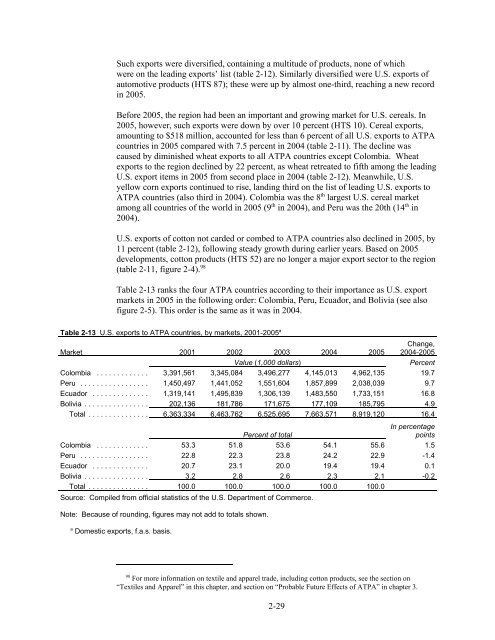
Such exports were diversified, containing a multitude <strong>of</strong> products, none <strong>of</strong> whichwere on <strong>the</strong> leading exports’ list (table 2-12). Similarly diversified were U.S. exports <strong>of</strong>automotive products (HTS 87); <strong>the</strong>se were up by almost one-third, reaching a new recordin 2005.Before 2005, <strong>the</strong> region had been an important and growing market for U.S. cereals. In2005, however, such exports were down by over 10 percent (HTS 10). Cereal exports,amounting to $518 million, accounted for less than 6 percent <strong>of</strong> all U.S. exports to ATPAcountries in 2005 compared with 7.5 percent in 2004 (table 2-11). <strong>The</strong> decline wascaused by diminished wheat exports to all ATPA countries except Colombia. Wheatexports to <strong>the</strong> region declined by 22 percent, as wheat retreated to fifth among <strong>the</strong> leadingU.S. export items in 2005 from second place in 2004 (table 2-12). Meanwhile, U.S.yellow corn exports continued to rise, landing third on <strong>the</strong> list <strong>of</strong> leading U.S. exports toATPA countries (also third in 2004). Colombia was <strong>the</strong> 8 th largest U.S. cereal marketamong all countries <strong>of</strong> <strong>the</strong> world in 2005 (9 th in 2004), and Peru was <strong>the</strong> 20th (14 th in2004).U.S. exports <strong>of</strong> cotton not carded or combed to ATPA countries also declined in 2005, by11 percent (table 2-12), following steady growth during earlier years. Based on 2005developments, cotton products (HTS 52) are no longer a major export sector to <strong>the</strong> region(table 2-11, figure 2-4). 98Table 2-13 ranks <strong>the</strong> four ATPA countries according to <strong>the</strong>ir importance as U.S. exportmarkets in 2005 in <strong>the</strong> following order: Colombia, Peru, Ecuador, and Bolivia (see als<strong>of</strong>igure 2-5). This order is <strong>the</strong> same as it was in 2004.Table 2-13 U.S. exports to ATPA countries, by markets, 2001-2005 aMarket 2001 2002 2003 2004 2005Change,2004-2005Value (1,000 dollars)PercentColombia ............. 3,391,561 3,345,084 3,496,277 4,145,013 4,962,135 19.7Peru ................. 1,450,497 1,441,052 1,551,604 1,857,899 2,038,039 9.7Ecuador .............. 1,319,141 1,495,839 1,306,139 1,483,550 1,733,151 16.8Bolivia ................ 202,136 181,786 171,675 177,109 185,795 4.9Total ............... 6,363,334 6,463,762 6,525,695 7,663,571 8,919,120 16.4Percent <strong>of</strong> totalIn percentagepointsColombia ............. 53.3 51.8 53.6 54.1 55.6 1.5Peru ................. 22.8 22.3 23.8 24.2 22.9 -1.4Ecuador .............. 20.7 23.1 20.0 19.4 19.4 0.1Bolivia ................ 3.2 2.8 2.6 2.3 2.1 -0.2Total ............... 100.0 100.0 100.0 100.0 100.0Source: Compiled from <strong>of</strong>ficial statistics <strong>of</strong> <strong>the</strong> U.S. Department <strong>of</strong> Commerce.Note: Because <strong>of</strong> rounding, figures may not add to totals shown.a Domestic exports, f.a.s. basis.98For more information on textile and apparel trade, including cotton products, see <strong>the</strong> section on“Textiles and Apparel” in this chapter, and section on “Probable Future Effects <strong>of</strong> ATPA” in chapter 3.2-29


