Poster Abstracts - Kepler - NASA
Poster Abstracts - Kepler - NASA
Poster Abstracts - Kepler - NASA
- No tags were found...

You also want an ePaper? Increase the reach of your titles
YUMPU automatically turns print PDFs into web optimized ePapers that Google loves.
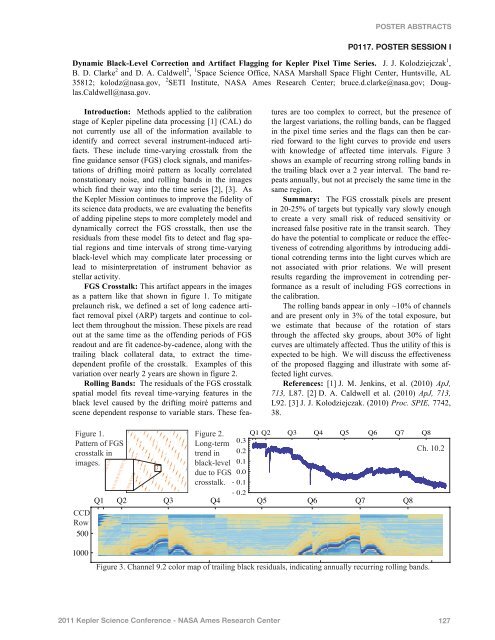
POSTER ABSTRACTSP0117. POSTER SESSION IDynamic Black-Level Correction and Artifact Flagging for <strong>Kepler</strong> Pixel Time Series. J. J. Kolodziejczak 1 ,B. D. Clarke 2 and D. A. Caldwell 2 , 1 Space Science Office, <strong>NASA</strong> Marshall Space Flight Center, Huntsville, AL35812; kolodz@nasa.gov, 2 SETI Institute, <strong>NASA</strong> Ames Research Center; bruce.d.clarke@nasa.gov; Douglas.Caldwell@nasa.gov.Introduction: Methods applied to the calibrationstage of <strong>Kepler</strong> pipeline data processing [1] (CAL) donot currently use all of the information available toidentify and correct several instrument-induced artifacts.These include time-varying crosstalk from thefine guidance sensor (FGS) clock signals, and manifestationsof drifting moiré pattern as locally correlatednonstationary noise, and rolling bands in the imageswhich find their way into the time series [2], [3]. Asthe <strong>Kepler</strong> Mission continues to improve the fidelity ofits science data products, we are evaluating the benefitsof adding pipeline steps to more completely model anddynamically correct the FGS crosstalk, then use theresiduals from these model fits to detect and flag spatialregions and time intervals of strong time-varyingblack-level which may complicate later processing orlead to misinterpretation of instrument behavior asstellar activity.FGS Crosstalk: This artifact appears in the imagesas a pattern like that shown in figure 1. To mitigateprelaunch risk, we defined a set of long cadence artifactremoval pixel (ARP) targets and continue to collectthem throughout the mission. These pixels are readout at the same time as the offending periods of FGSreadout and are fit cadence-by-cadence, along with thetrailing black collateral data, to extract the timedependentprofile of the crosstalk. Examples of thisvariation over nearly 2 years are shown in figure 2.Rolling Bands: The residuals of the FGS crosstalkspatial model fits reveal time-varying features in theblack level caused by the drifting moiré patterns andscene dependent response to variable stars. These featuresare too complex to correct, but the presence ofthe largest variations, the rolling bands, can be flaggedin the pixel time series and the flags can then be carriedforward to the light curves to provide end userswith knowledge of affected time intervals. Figure 3shows an example of recurring strong rolling bands inthe trailing black over a 2 year interval. The band repeatsannually, but not at precisely the same time in thesame region.Summary: The FGS crosstalk pixels are presentin 20-25% of targets but typically vary slowly enoughto create a very small risk of reduced sensitivity orincreased false positive rate in the transit search. Theydo have the potential to complicate or reduce the effectivenessof cotrending algorithms by introducing additionalcotrending terms into the light curves which arenot associated with prior relations. We will presentresults regarding the improvement in cotrending performanceas a result of including FGS corrections inthe calibration.The rolling bands appear in only ~10% of channelsand are present only in 3% of the total exposure, butwe estimate that because of the rotation of starsthrough the affected sky groups, about 30% of lightcurves are ultimately affected. Thus the utility of this isexpected to be high. We will discuss the effectivenessof the proposed flagging and illustrate with some affectedlight curves.References: [1] J. M. Jenkins, et al. (2010) ApJ,713, L87. [2] D. A. Caldwell et al. (2010) ApJ, 713,L92. [3] J. J. Kolodziejczak. (2010) Proc. SPIE, 7742,38.Figure 1.Pattern of FGScrosstalk inimages.Figure 2.Long-termtrend inblack-levelQ1 Q2 Q3 Q4 Q5 Q6 Q7 Q80.30.2Ch. 10.20.1due to FGS 0.0crosstalk. - 0.1- 0.2Q1 Q2 Q3 Q4 Q5 Q6 Q7 Q8CCDRow5001000Figure 3. Channel 9.2 color map 10of 000 trailing black residuals, indicating 20 000 annually recurring rolling bands. 30 0002011 <strong>Kepler</strong> Science Conference - <strong>NASA</strong> Ames Research Center 127