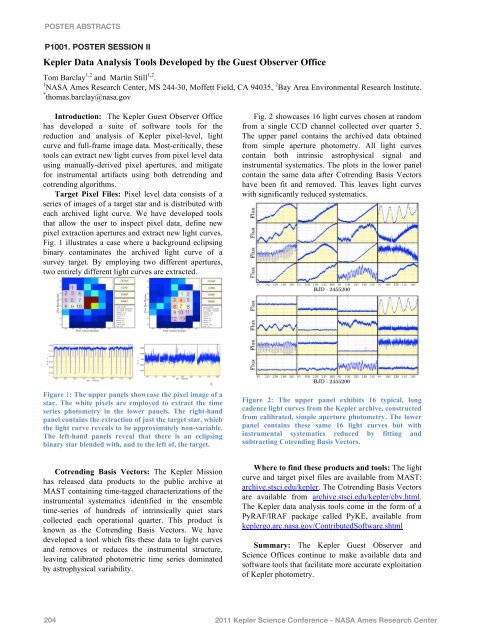
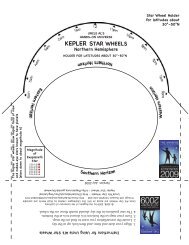
POSTER ABSTRACTSP1001. POSTER SESSION II<strong>Kepler</strong> Data Analysis Tools Developed by the Guest Observer OfficeTom Barclay 1,2 and Martin Still 1,2 .1 <strong>NASA</strong> Ames Research Center, MS 244-30, Moffett Field, CA 94035, 2 Bay Area Environmental Research Institute.* thomas.barclay@nasa.govIntroduction: The <strong>Kepler</strong> Guest Observer Officehas developed a suite of software tools for thereduction and analysis of <strong>Kepler</strong> pixel-level, lightcurve and full-frame image data. Most-critically, thesetools can extract new light curves from pixel level datausing manually-derived pixel apertures, and mitigatefor instrumental artifacts using both detrending andcotrending algorithms.Target Pixel Files: Pixel level data consists of aseries of images of a target star and is distributed witheach archived light curve. We have developed toolsthat allow the user to inspect pixel data, define newpixel extraction apertures and extract new light curves.Fig. 1 illustrates a case where a background eclipsingbinary contaminates the archived light curve of asurvey target. By employing two different apertures,two entirely different light curves are extracted.Fig. 2 showcases 16 light curves chosen at randomfrom a single CCD channel collected over quarter 5.The upper panel contains the archived data obtainedfrom simple aperture photometry. All light curvescontain both intrinsic astrophysical signal andinstrumental systematics. The plots in the lower panelcontain the same data after Cotrending Basis Vectorshave been fit and removed. This leaves light curveswith significantly reduced systematics.Figure 1: The upper panels showcase the pixel image of astar. The white pixels are employed to extract the timeseries photometry in the lower panels. The right-handpanel contains the extraction of just the target star, whichthe light curve reveals to be approximately non-variable.The left-hand panels reveal that there is an eclipsingbinary star blended with, and to the left of, the target.Figure 2: The upper panel exhibits 16 typical, longcadence light curves from the <strong>Kepler</strong> archive, constructedfrom calibrated, simple aperture photometry. The lowerpanel contains these same 16 light curves but withinstrumental systematics reduced by fitting andsubtracting Cotrending Basis Vectors.Cotrending Basis Vectors: The <strong>Kepler</strong> Missionhas released data products to the public archive atMAST containing time-tagged characterizations of theinstrumental systematics identified in the ensembletime-series of hundreds of intrinsically quiet starscollected each operational quarter. This product isknown as the Cotrending Basis Vectors. We havedeveloped a tool which fits these data to light curvesand removes or reduces the instrumental structure,leaving calibrated photometric time series dominatedby astrophysical variability.Where to find these products and tools: The lightcurve and target pixel files are available from MAST:archive.stsci.edu/kepler. The Cotrending Basis Vectorsare available from archive.stsci.edu/kepler/cbv.html.The <strong>Kepler</strong> data analysis tools come in the form of aPyRAF/IRAF package called PyKE, available fromkeplergo.arc.nasa.gov/ContributedSoftware.shtmlSummary: The <strong>Kepler</strong> Guest Observer andScience Offices continue to make available data andsoftware tools that facilitate more accurate exploitationof <strong>Kepler</strong> photometry.2042011 <strong>Kepler</strong> Science Conference - <strong>NASA</strong> Ames Research Center
POSTER ABSTRACTSP1002. POSTER SESSION IIRECENT OPERATIONAL IMPROVEMENTS TO HIGH PRECISION PHOTOMETRICOBSERVATIONS WITH WARM IRAC. S. Carey 1 , J. Krick 1 , J. Ingalls 1 , K. von Braun 2 , J. Stauffer 1 , D. Charbonneau3 , S. Ballard 3 , M. Fisher 4 , R. Olds 4 , 1 Spitzer Science Center, MS 220-6 Caltech, Pasadena, CA 91125;carey@ipac.caltech.edu, 2 IPAC, 3 Harvard-Smithsonian Center for Astrophysics, 4 Lockheed Martin Denver.The Spitzer project has recently made several improvementsto the warm IRAC staring mode observations.This type of observation is critical not only forconfirming <strong>Kepler</strong> planet candidates [1], but also formeasuring transiting exoplanet atmospheric thermalprofiles [2], atmospheric chemical compositions [3],and global wind and energy transport mechanisms. TheIRAC 3.6 and 4.5 µm observations have significantphotometric systematics due to a coupling of telescopemotions with intra-pixel gain variations. These systematicsare being trended with increasingly sophisticatedtechniques [4,5]. To mitigate the effect of thesesystematics in the data themselves, a cycling of a onboardheater was modified to reduce by ~50% both theamplitude and period of the pointing wobble, therebyreducing the aliasing of transits and improving photometricaccuracy.Most recently, we have commissioned a peakupmode to improve pointing for IRAC observations. Figure1 displays the results of an experiment testing therepeatability and stability of the peakup mode. Asshown, almost all of the ten individual observationsland in the same 0.2 x 0.2 pixel region (which hasminimal gain variation, the sweet-spot) with each epochhaving excellent scatter (0.03 arcsec, 1σ radial rmsover 2 minutes). This is a factor of 10 improvementover blind pointing. The peakup uses the opticalpeakup instrument (PCRS [6]) on the cryogenic focalplane previously used with great effectiveness with theIRS spectrometer. Preliminary high-precision (~10 -4 )gain maps of the sweet-spots will be presented. Coupledwith science data taken at these sweet-spots, thegain maps permit observers to remove systematics inthe photometry due to intra-pixel gain without selfcalibratingtheir observations. Not only will this improvethe removal of the systematics and precision ofthe observations, but it also lessens the likelihood ofmodifying scientifically interesting signatures such asatmospheric variations of the exoplanet or host star.The peakup mode has been demonstrated for targetstars with visible magnitude between 7 and 12.5 withfainter targets limited by the amount of data that can bestored and processed by the on-board computer whilebrighter sources saturate the PCRS detector. Forsources outside of the peakup magnitude limits, preliminarytests have shown that the available PCRSguide stars can be used to accurately place the targeton the IRAC arrays. These tests suggest that thepeakup will be available for the full magnitude rangeof <strong>Kepler</strong> exoplanets. We present results of a recentdemonstration using KOI-069.Use of the peakup mode should prove beneficialfor full-phase light curve observations and other staresof greater than 24 hours. By performing peakups every~8 hours, the ~0.3 arcsec/day pointing drift seen inlong stares can be mitigated, while other solutions continueto be explored. In addition, tests are ongoing todemonstrate that light curves can be sampled sparselyand still recover phase variations. Sparse sampling hastwo benefits over traditional full-phase monitoring; 1)the curve can be sampled using ~50% of the observingtime, and 2) the observations can be scheduled moreflexibly, improving the likelihood of having the observationexecuted.Full commissioning of the mode is ongoing withthe expectation that all high-precision photometricobservations will use peakups by the beginning of2012. Use of the mode can continue as long as Spitzeris operating and should permit photon-limited followupand characteriztion of all <strong>Kepler</strong> discoveries.References: [1] Fressin et al. (2011)arXiv:1105.4647. [2] Beerer et al. (2011) ApJ, 727, 23.[3] Fortney et al. (2011) arXiv:1109:1611. [4] Ballardet al. (2010) PASP, 122, 897. [5] Demory et al. (2011)A&A, 533, A114. [6] Mainzer & Young (2004) SPIE,5487, 93.Figure 1: Centroid positions for ten epochs of the4.5 µm subarray PCRS peakup test. Each epoch (representedby a different color) consists of an initial slewto the PCRS, peakup on the PCRS, offset to IRAC and2.25 minutes of 0.4 second frames while staring. Thebox indicates the 0.2 x 0.2 region of the pixel withminimal gain variations that (sweet-spot).2011 <strong>Kepler</strong> Science Conference - <strong>NASA</strong> Ames Research Center 205