POSTER ABSTRACTSP0138. POSTER SESSION INEW DIRECTIONS IN KEPLER CORRECTIONSJ. Van Cleve *1 , T. Barclay 2 , M. N. Fanelli 2 , J. M. Jenkins 1 , J. Kolodziejczak 3 , R. Morris 1 , J. C. Smith 1 , M. C.Stumpe 1 , J. Twicken 1* jeffrey.vancleve@nasa.gov, 1 SETI Institute/<strong>NASA</strong> Ames Research Center, MS 244-30, Moffett Field, CA 94035,USA, 2 Bay Area Environmental Research Institute, 3 <strong>NASA</strong> Marshall Space Flight Center,Introduction: The Presearch Data Conditioning(PDC) module of the <strong>Kepler</strong> science data analysisPipeline does well at the task for which it was originallydesigned: removing systematic errors from fluxtime series while preserving transit signals for the>70% of planetary search target stars which are notintrinsically variable. However, astrophysically interestingsignals from variable stars were often distortedor destroyed by the versions of PDC used on data releasedbefore 10/1/2011. A companion poster bySmith et al. decribes the great progress made in PDC8.0 towards preserving astrophysical signals whilemaintaining sensitivity to transits, using an empiricalBayesian approach [1,2]. In a nutshell, this approachuses the distribution of least-squares fit parameters in areference ensemble of light curves as prior informationto moderate the values of the coeffieients for each target.An obvious area of further progress is to decouplelow and high frequency systematic noise, using wavelet-basedband splitting as described in the companionposter by Stumpe et al. Detection and repair of singlepixelsensitivity dropouts (SPSDs), while not systematicerrors in themselves, are an integral part of PDCand the current algorithms and improvements are describedin a companion poster by Morris and Kolodziejczak.Current Investigations: In this poster, we describeother ongoing efforts to further improve systematicerror correction in PDC after Release 8.0, whichinclude5. Joint fitting of CBVs, cosmic-ray inducedsingle-pixel sensitivity dropouts (SPSDs),and low-frequency astrophysical signalsrepresented by polynomials.Funding for this work is provided by the <strong>NASA</strong>Science Mission Directorate.References:[1] Jenkins, J.M., J.C. Smith, P. Tenenbaum, J. D.Twicken, and J. Van Cleve, “Planet Detection: The<strong>Kepler</strong> Mission,” in Advances in Machine Learningand Data Mining for Astronomy (eds. M. Way, J.Scargle, K. Ali, A. Srivastava), Chapman andHall/CRC Press, 2011.[2] S. M. Kay. Fundamentals of Statistical SignalProcessing: Estimation Theory. New Jersey: PrenticeHall PTR, 19931. Development of a goodness metric whichdetects noise injection, signal distortion,and residual correlations between correctedlight curves, as a guide to progressin items below.2. Improved reference light curve ensembleselection and resulting cotrending basisvector (CBV) set generation.3. Adaptive selection of the number of CBVsused to fit and remove systematic errors4. Improvement of the prior distribution, bya) generalizing the coefficient distributionspace to dimensions beyond the currentlyusedRA, DEC, and <strong>Kepler</strong> magnitude b)Using cluster analysis to identify groupsof stars with similar systematic errors andgenerating cluster-specific CBVs1482011 <strong>Kepler</strong> Science Conference - <strong>NASA</strong> Ames Research Center
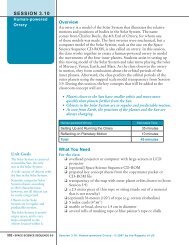
POSTER ABSTRACTSP0201. POSTER SESSION IHow Close are <strong>Kepler</strong> Systems to Being Dynamically Packed? (And Implications for η Earth .)R. Belikov 1 and M. J. Kuchner 21 <strong>NASA</strong> Ames Research Center, M/S 245-6, P.O.Box 1, Moffett Field, CA94035, Ruslan.Belikov@nasa.gov,2 <strong>NASA</strong> Goddard Space Flight Center, marc.j.kuchner@nasa.govThe release of data on <strong>Kepler</strong> planet candidates [1]was shortly followed by several papers analyzing planetfrequency statistics (e.g. [2], [3]) as well as onesthat attempt to extrapolate the data to Earth-like planetsizes and distances from the star (e.g. [4], [5]). Eventhough these papers took care to compensate for incompletenessand observational biases, results for η Earthbased on different extapolations vary by two orders ofmagnitude, from about 1% to 50%. It would seem thatat present the <strong>Kepler</strong> statistics alone may not be completeenough yet to get a firm handle on η Earth .However, certain firm conclusions can neverthelessbe drawn when considering the <strong>Kepler</strong> data not by itself,but in combination with the requirement that stableplanetary systems must not have more planets thanallowed by full dynamical packing.Number of planets per (Sun-like) star per decade of period10 1 dynamical packing limit for R min= 0.5 R Earthdynamical packing limit for R min= 2 R Earth10 0 extrapolation to smallerTraub et. al. 2011masses (R > 0.5 R Earth)extrapolationsto longer periodsthis paper10 -1planets with R > 2 R Earth Catanzarite&Shao 201110 -2<strong>Kepler</strong> measurement(Howard et. al. 2011)10 -310 -410 0 10 1 10 2 10 3Period (days)Figure 1. Planet distribution functions in log period.The dynamical packing hypothesis explains theasymptoting behavior of the data and motivates anextrapolation to longer periods that does not rely onincomplete statistics.Figure 1 illustrates this idea, which shows severalplanet frequency distributions as a function of logperiodfor Sun-like stars. The blue lines represent planetswith radii down to 2 R Earth and green linesrepresent planets with radii down to 0.5 R Earth . The bluecurved line out to period of ~40 days represents theexpected frequency measured by the <strong>Kepler</strong> scienceteam based on relatively complete debiased data [2].The horizontal lines on the top show the limits on thefrequency of planets imposed by dynamical packing(i.e. any more planets and the system will become unstable).These limits were calculated based on the workin [6] and planet masses were converted to radii basedon the mass-radius relationships predicted in [7].It has been hypothesized that most planetary systemsmay be close to being dynamically packed [8].Figure 1 shows that this is indeed the case at least inthe vicinity of 20-40-day periods, where the frequencyof planets down to 0.5 R Earth are within an order ofmagnitude (21%) of the dynamical packing limit. The21% number assumes conservatively that there are noplanets or other objects smaller than 0.5 R Earth aroundany <strong>Kepler</strong> stars (where there is very little <strong>Kepler</strong> data).Should the observed <strong>Kepler</strong> planet size power law holddown to ~0.1 R Earth , then all systems would be fullydynamically packed, and if any objects exist that aresmaller than 0.1 R Earth , they would not be on stableisolated orbits. Notably, this is exactly the case with theSolar System, where objects smaller than ~ 0.1 R Earth ,e.g. asteroids, tend to exist in a dynamic belt.This suggests an explanation for why the measuredplanet frequencies on Figure 1 are starting to level offbeyond 10-day periods: they are asymptoting to thedynamical packing limit. If this is so, we would expectthe planet frequency to remain flat beyond 40 day periods,as shown by the dashed line in Figure 1. Such acurve would imply that η Earth is 23% and 89% for planetsbetween 1 and 2 R Earth , and 0.5 and 2 R Earth , respectively(using the more conservative definition ofthe habitable zone as having a semi-major axis between0.95 and 1.37 (L/L Sun ) 1/2 a.u.)The combination of the dynamical packing hypothesisand <strong>Kepler</strong> statistics also allows us to predict thedistribution of planet distrubution around many otherparameters, such as star mass, and we perform a generalanalysis of this in our paper.References:[1] Borucki, W. J., et. al. 2011, ApJ, 736, 19B.[2] Howard, A. W., et. al., 2011, ApJ submitted.[3] Youdin, A. N., et. al., 2011, ApJ submitted.[4] Catanzarite, J., Shao, M., 2011, ApJ, 738, 151C[5] Traub, W. A., 2011, ApJ submitted.[6] Chambers, J.E., et. al., 1996, Icarus 119, 261.[7] Seager, S., 2007, ApJ 669, 1279.[8] Barnes, R., Raymond, S.N 2004, ApJ, 617,569.2011 <strong>Kepler</strong> Science Conference - <strong>NASA</strong> Ames Research Center 149