Poster Abstracts - Kepler - NASA
Poster Abstracts - Kepler - NASA
Poster Abstracts - Kepler - NASA
- No tags were found...

Create successful ePaper yourself
Turn your PDF publications into a flip-book with our unique Google optimized e-Paper software.
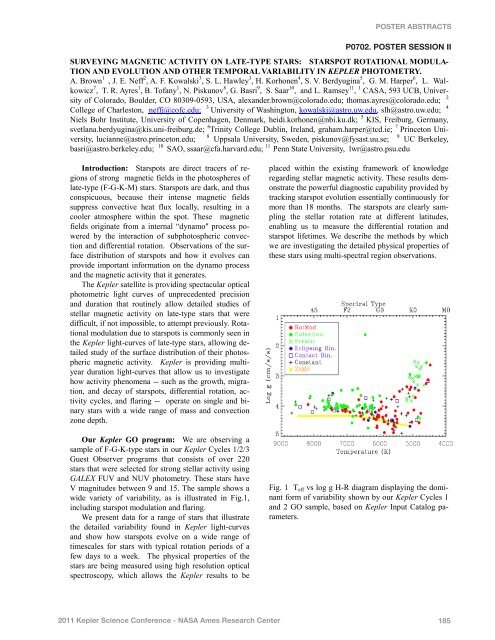
POSTER ABSTRACTSP0702. POSTER SESSION IISURVEYING MAGNETIC ACTIVITY ON LATE-TYPE STARS: STARSPOT ROTATIONAL MODULA-TION AND EVOLUTION AND OTHER TEMPORAL VARIABILITY IN KEPLER PHOTOMETRY.A. Brown 1 , J. E. Neff 2 , A. F. Kowalski 3 , S. L. Hawley 3 , H. Korhonen 4 , S. V. Berdyugina 5 , G. M. Harper 6 , L. Walkowicz7 , T. R. Ayres 1 , B. Tofany 1 , N. Piskunov 8 , G. Basri 9 , S. Saar 10 , and L. Ramsey 11 , 1 CASA, 593 UCB, Universityof Colorado, Boulder, CO 80309-0593, USA, alexander.brown@colorado.edu; thomas.ayres@colorado.edu; 2College of Charleston, neffj@cofc.edu;3 4University of Washington, kowalski@astro.uw.edu, slh@astro.uw.edu;Niels Bohr Institute, University of Copenhagen, Denmark, heidi.korhonen@nbi.ku.dk; 5 KIS, Freiburg, Germany,svetlana.berdyugina@kis.uni-freiburg.de; 6 Trinity College Dublin, Ireland, graham.harper@tcd.ie; 7 Princeton University,lucianne@astro.princeton.edu;8 Uppsala University, Sweden, piskunov@fysast.uu.se;9 UC Berkeley,basri@astro.berkeley.edu; 10 SAO, ssaar@cfa.harvard.edu; 11 Penn State University, lwr@astro.psu.eduIntroduction: Starspots are direct tracers of regionsof strong magnetic fields in the photospheres oflate-type (F-G-K-M) stars. Starspots are dark, and thusconspicuous, because their intense magnetic fieldssuppress convective heat flux locally, resulting in acooler atmosphere within the spot. These magneticfields originate from a internal “dynamo'' process poweredby the interaction of subphotospheric convectionand differential rotation. Observations of the surfacedistribution of starspots and how it evolves canprovide important information on the dynamo processand the magnetic activity that it generates.The <strong>Kepler</strong> satellite is providing spectacular opticalphotometric light curves of unprecedented precisionand duration that routinely allow detailed studies ofstellar magnetic activity on late-type stars that weredifficult, if not impossible, to attempt previously. Rotationalmodulation due to starspots is commonly seen inthe <strong>Kepler</strong> light-curves of late-type stars, allowing detailedstudy of the surface distribution of their photosphericmagnetic activity. <strong>Kepler</strong> is providing multiyearduration light-curves that allow us to investigatehow activity phenomena -- such as the growth, migration,and decay of starspots, differential rotation, activitycycles, and flaring -- operate on single and binarystars with a wide range of mass and convectionzone depth.Our <strong>Kepler</strong> GO program: We are observing asample of F-G-K-type stars in our <strong>Kepler</strong> Cycles 1/2/3Guest Observer programs that consists of over 220stars that were selected for strong stellar activity usingGALEX FUV and NUV photometry. These stars haveV magnitudes between 9 and 15. The sample shows awide variety of variability, as is illustrated in Fig.1,including starspot modulation and flaring.We present data for a range of stars that illustratethe detailed variability found in <strong>Kepler</strong> light-curvesand show how starspots evolve on a wide range oftimescales for stars with typical rotation periods of afew days to a week. The physical properties of thestars are being measured using high resolution opticalspectroscopy, which allows the <strong>Kepler</strong> results to beplaced within the existing framework of knowledgeregarding stellar magnetic activity. These results demonstratethe powerful diagnostic capability provided bytracking starspot evolution essentially continuously formore than 18 months. The starspots are clearly samplingthe stellar rotation rate at different latitudes,enabling us to measure the differential rotation andstarspot lifetimes. We describe the methods by whichwe are investigating the detailed physical properties ofthese stars using multi-spectral region observations.Fig. 1 T eff vs log g H-R diagram displaying the dominantform of variability shown by our <strong>Kepler</strong> Cycles 1and 2 GO sample, based on <strong>Kepler</strong> Input Catalog parameters.2011 <strong>Kepler</strong> Science Conference - <strong>NASA</strong> Ames Research Center 185