POSTER ABSTRACTSP0707. POSTER SESSION IISTATISTICS OF STELLAR VARIABILITY IN KEPLER DATA WITH ARC SYSTEMATICS REMOVALA. McQuillan 1 , S. Aigrain 2 , S. Roberts 3 , 1 University of Oxford, Oxford Astrophysics, Keble Road, Oxford OX13RH, UK, amy.mcquillan@astro.ox.ac.uk, 2 University of Oxford, suzanne.aigrain@astro.ox.ac.uk, 3 University ofOxford, sjrob@robots.ox.ac.ukSystematics Correction: We investigate the variabilityproperties of main sequence stars in the public<strong>Kepler</strong> data. The <strong>Kepler</strong> pipeline (PDC), like othercurrent reduction methods, is unsuitable for the studyof stellar variability so a new Astrophysically RobustCorrection for systematics (ARC) was developed. Thekey feature of our reduction is the removal of a set ofbasis functions that are determined to be present insmall amounts across many light curves, therefore effectivelyremoving systematics while leaving the truevariability signal unchanged. Full details of thismethod can be found in Roberts et al. [1]. The improvementcan be seen in Figure 1, which shows anapparent bimodality in variability where the PDC hasremoved intrinsic stellar signals at medium variabilitylevels, while the ARC preserves them.The frequency content of the light curves showsevidence for periodic or quasi-periodic behaviour in16% of dwarf stars. The fraction and typical periodvary between spectral types, as shown in Figure 2. Itshould be noted that there are specific caveats that applyto this distribution, based on the length of thedataset and the period selection method. Full details ofthis can be found in McQuillan et al. [5].Figure 1. Variability (defined as 5 th – 95 th percentile ofnormalized flux) for the PDC and ARC data, with thephotometric uncertainty (red solid line) and twice thesolar value (red dashed line).Variability Statistics: Using the ARC data we revisitand confirm many of the relationships presentedby Basri et al. [2],[3] and Ciardi et al. [4], and extendthis work to a more thorough study of the periodic andstochastic nature of the variability.We divide the targets into high- and low-variabilitygroups by comparison to the active Sun (dashed redline in Figure 1), allowing us to examine the stellarproperties of each sample. Using this method, 36% ofdwarf stars observed by <strong>Kepler</strong> appear more variablethan the active Sun on a 33 day timescale.We determine the variability statistics per spectraltype, and show tenuous evidence that that the highvariabilitysample typically have lower proper motion.Variability is seen to increase with decreasing temperatureand there exist significant differences in the natureof variability between spectral types.Figure 2. Period distribution for each spectral type, forstars displaying a significant period, showing a cleartrend towards longer periods for later type stars. SeeMcQuillan et al. [5] for caveats.The stochastic component of variability associatedwith each spectral type was parameterised by fittingautoregressive models to the periodograms, as used byAigrain et al. [6]. This analysis shows a trend of increasingamplitude and timescale towards later spectraltypes.Most A and F stars have short periods (< 2 days)and highly sinusoidal variability, suggestive of pulsations.Their spectral density distribution implies theyare accompanied by small scale, short-lived active regions.G, K and M stars tend to have longer periods(> 5 days, with a trend towards longer periods at laterspectral types) and show a mixture of periodic andstochastic variability, indicative of activity. For theselate type stars the activity regions also appear largerand more stable.References: [1] Roberts et al. (in prep.). [2] Basriet al. (2010) ApJ Letters, 713, L155. [3] Basri et al.(2011) AJ, 141, 20. [4] Ciardi et al. (2011) AJ, 141,108. [5] McQuillan et al. (in prep). [6] Aigrain et al.(2004) A&A, 414, 1139.1902011 <strong>Kepler</strong> Science Conference - <strong>NASA</strong> Ames Research Center
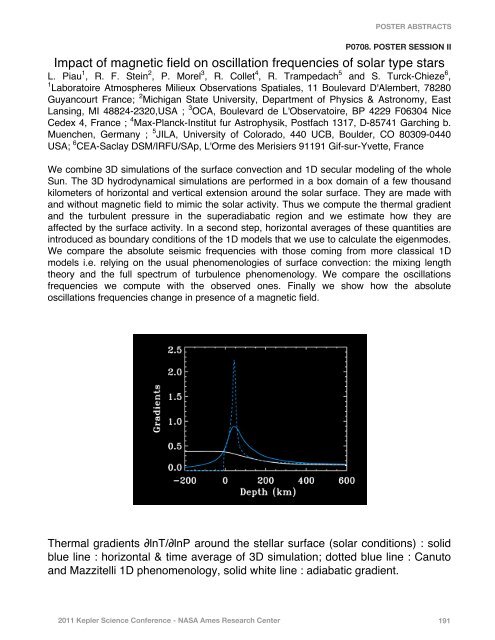
POSTER ABSTRACTSP0708. POSTER SESSION IIImpact of magnetic field on oscillation frequencies of solar type starsL. Piau 1 , R. F. Stein 2 , P. Morel 3 , R. Collet 4 , R. Trampedach 5 and S. Turck-Chieze 6 ,1 Laboratoire Atmospheres Milieux Observations Spatiales, 11 Boulevard D'Alembert, 78280Guyancourt France; 2 Michigan State University, Department of Physics & Astronomy, EastLansing, MI 48824-2320,USA ; 3 OCA, Boulevard de L'Observatoire, BP 4229 F06304 NiceCedex 4, France ; 4 Max-Planck-Institut fur Astrophysik, Postfach 1317, D-85741 Garching b.Muenchen, Germany ; 5 JILA, University of Colorado, 440 UCB, Boulder, CO 80309-0440USA; 6 CEA-Saclay DSM/IRFU/SAp, L'Orme des Merisiers 91191 Gif-sur-Yvette, FranceWe combine 3D simulations of the surface convection and 1D secular modeling of the wholeSun. The 3D hydrodynamical simulations are performed in a box domain of a few thousandkilometers of horizontal and vertical extension around the solar surface. They are made withand without magnetic field to mimic the solar activity. Thus we compute the thermal gradientand the turbulent pressure in the superadiabatic region and we estimate how they areaffected by the surface activity. In a second step, horizontal averages of these quantities areintroduced as boundary conditions of the 1D models that we use to calculate the eigenmodes.We compare the absolute seismic frequencies with those coming from more classical 1Dmodels i.e. relying on the usual phenomenologies of surface convection: the mixing lengththeory and the full spectrum of turbulence phenomenology. We compare the oscillationsfrequencies we compute with the observed ones. Finally we show how the absoluteoscillations frequencies change in presence of a magnetic field.Thermal gradients ∂lnT/∂lnP around the stellar surface (solar conditions) : solidblue line : horizontal & time average of 3D simulation; dotted blue line : Canutoand Mazzitelli 1D phenomenology, solid white line : adiabatic gradient.2011 <strong>Kepler</strong> Science Conference - <strong>NASA</strong> Ames Research Center 191