Background_E_Market_Assessment - Shoalhaven City Council ...
Background_E_Market_Assessment - Shoalhaven City Council ...
Background_E_Market_Assessment - Shoalhaven City Council ...

Create successful ePaper yourself
Turn your PDF publications into a flip-book with our unique Google optimized e-Paper software.
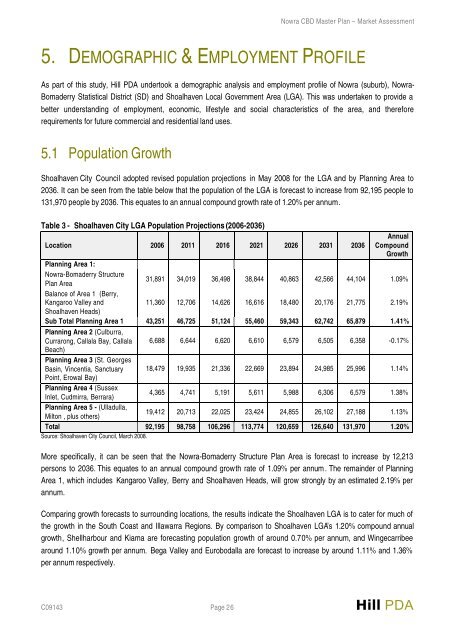
Nowra CBD Master Plan – <strong>Market</strong> <strong>Assessment</strong>5. DEMOGRAPHIC & EMPLOYMENT PROFILEAs part of this study, Hill PDA undertook a demographic analysis and employment profile of Nowra (suburb), Nowra-Bomaderry Statistical District (SD) and <strong>Shoalhaven</strong> Local Government Area (LGA). This was undertaken to provide abetter understanding of employment, economic, lifestyle and social characteristics of the area, and thereforerequirements for future commercial and residential land uses.5.1 Population Growth<strong>Shoalhaven</strong> <strong>City</strong> <strong>Council</strong> adopted revised population projections in May 2008 for the LGA and by Planning Area to2036. It can be seen from the table below that the population of the LGA is forecast to increase from 92,195 people to131,970 people by 2036. This equates to an annual compound growth rate of 1.20% per annum.Table 3 - <strong>Shoalhaven</strong> <strong>City</strong> LGA Population Projections (2006-2036)Location 2006 2011 2016 2021 2026 2031 2036AnnualCompoundGrowthPlanning Area 1:Nowra-Bomaderry StructurePlan Area31,891 34,019 36,498 38,844 40,863 42,566 44,104 1.09%Balance of Area 1 (Berry,Kangaroo Valley and11,360 12,706 14,626 16,616 18,480 20,176 21,775 2.19%<strong>Shoalhaven</strong> Heads)Sub Total Planning Area 1 43,251 46,725 51,124 55,460 59,343 62,742 65,879 1.41%Planning Area 2 (Culburra,Currarong, Callala Bay, Callala 6,688 6,644 6,620 6,610 6,579 6,505 6,358 -0.17%Beach)Planning Area 3 (St. GeorgesBasin, Vincentia, Sanctuary 18,479 19,935 21,336 22,669 23,894 24,985 25,996 1.14%Point, Erowal Bay)Planning Area 4 (SussexInlet, Cudmirra, Berrara)4,365 4,741 5,191 5,611 5,988 6,306 6,579 1.38%Planning Area 5 - (Ulladulla,Milton , plus others)19,412 20,713 22,025 23,424 24,855 26,102 27,188 1.13%Total 92,195 98,758 106,296 113,774 120,659 126,640 131,970 1.20%Source: <strong>Shoalhaven</strong> <strong>City</strong> <strong>Council</strong>, March 2008.More specifically, it can be seen that the Nowra-Bomaderry Structure Plan Area is forecast to increase by 12,213persons to 2036. This equates to an annual compound growth rate of 1.09% per annum . The remainder of PlanningArea 1, which includes Kangaroo Valley, Berry and <strong>Shoalhaven</strong> Heads, will grow strongly by an estimated 2.19% perannum.Comparing growth forecasts to surrounding locations, the results indicate the <strong>Shoalhaven</strong> LGA is to cater for much ofthe growth in the South Coast and Illawarra Regions. By comparison to <strong>Shoalhaven</strong> LGA’s 1.20% compound annualgrowth, Shellharbour and Kiama are forecasting population growth of around 0.70% per annum, and Wingecarribeearound 1.10% growth per annum. Bega Valley and Eurobodalla are forecast to increase by around 1.11% and 1.36%per annum respectively.C09143 Page 26 Hill PDA