Background_E_Market_Assessment - Shoalhaven City Council ...
Background_E_Market_Assessment - Shoalhaven City Council ...
Background_E_Market_Assessment - Shoalhaven City Council ...

Create successful ePaper yourself
Turn your PDF publications into a flip-book with our unique Google optimized e-Paper software.
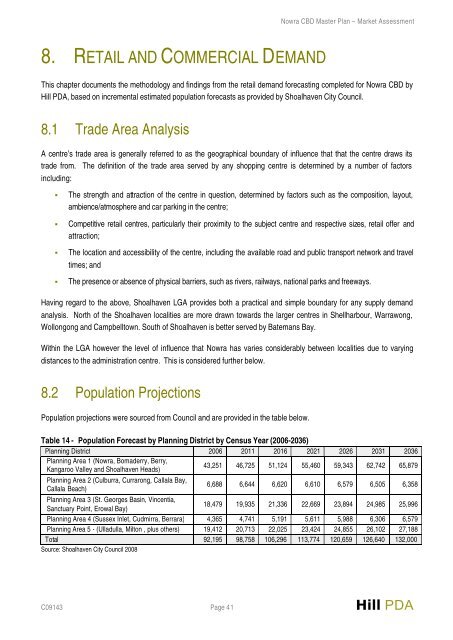
Nowra CBD Master Plan – <strong>Market</strong> <strong>Assessment</strong>8. RETAIL AND COMMERCIAL DEMANDThis chapter documents the methodology and findings from the retail demand forecasting completed for Nowra CBD byHill PDA, based on incremental estimated population forecasts as provided by <strong>Shoalhaven</strong> <strong>City</strong> <strong>Council</strong>.8.1 Trade Area AnalysisA centre’s trade area is generally referred to as the geographical boundary of influence that that the centre draws itstrade from. The definition of the trade area served by any shopping centre is determined by a number of factorsincluding:• The strength and attraction of the centre in question, determined by factors such as the composition, layout,ambience/atmosphere and car parking in the centre;• Competitive retail centres, particularly their proximity to the subject centre and respective sizes, retail offer andattraction;• The location and accessibility of the centre, including the available road and public transport network and traveltimes; and• The presence or absence of physical barriers, such as rivers, railways, national parks and freeways.Having regard to the above, <strong>Shoalhaven</strong> LGA provides both a practical and simple boundary for any supply demandanalysis. North of the <strong>Shoalhaven</strong> localities are more drawn towards the larger centres in Shellharbour, Warrawong,Wollongong and Campbelltown. South of <strong>Shoalhaven</strong> is better served by Batemans Bay.Within the LGA however the level of influence that Nowra has varies considerably between localities due to varyingdistances to the administration centre. This is considered further below.8.2 Population ProjectionsPopulation projections were sourced from <strong>Council</strong> and are provided in the table below.Table 14 - Population Forecast by Planning District by Census Year (2006-2036)Planning District 2006 2011 2016 2021 2026 2031 2036Planning Area 1 (Nowra, Bomaderry, Berry,Kangaroo Valley and <strong>Shoalhaven</strong> Heads)43,251 46,725 51,124 55,460 59,343 62,742 65,879Planning Area 2 (Culburra, Currarong, Callala Bay,Callala Beach)6,688 6,644 6,620 6,610 6,579 6,505 6,358Planning Area 3 (St. Georges Basin, Vincentia,Sanctuary Point, Erowal Bay)18,479 19,935 21,336 22,669 23,894 24,985 25,996Planning Area 4 (Sussex Inlet, Cudmirra, Berrara) 4,365 4,741 5,191 5,611 5,988 6,306 6,579Planning Area 5 - (Ulladulla, Milton , plus others) 19,412 20,713 22,025 23,424 24,855 26,102 27,188Total 92,195 98,758 106,296 113,774 120,659 126,640 132,000Source: <strong>Shoalhaven</strong> <strong>City</strong> <strong>Council</strong> 2008C09143 Page 41 Hill PDA