Nowra CBD Master Plan – <strong>Market</strong> <strong>Assessment</strong>Table 18 - Target Turnover Levels ($/sqm)* to 2036Store Type 2009** 2011 2016 2021 2026 2031 2036Supermarkets & Grocery Stores 9,941 10,070 10,402 10,745 11,098 11,464 11,841Specialty Food Stores 7,535 7,634 7,885 8,145 8,413 8,690 8,976Fast-Food Stores 7,535 7,634 7,885 8,145 8,413 8,690 8,976Restaurants 5,000 5,065 5,232 5,404 5,582 5,766 5,956Department Stores 3,500 3,546 3,662 3,783 3,908 4,036 4,169Clothing Stores 5,000 5,065 5,232 5,404 5,582 5,766 5,956Bulky Goods Stores 3,500 3,546 3,662 3,783 3,908 4,036 4,169Other Personal & Household Goods Retailing 5,000 5,065 5,232 5,404 5,582 5,766 5,956Selected Personal Services 3,000 3,039 3,139 3,243 3,349 3,460 3,573Total Retailing 5,700 5,774 5,968 6,168 6,374 6,586 6,804* Target turnover levels are around 5% below national average to reflect non-metropolitan average** Sources: ABS Retail Survey 1998-99 (escalated to 2009 dollars), Urbis Retail Averages, Shopping Centre News and various consultancy reportsDividing total expenditure by the above target turnover rates results in the following demand for floorspace in Nowra.Table 19 - Forecast Demand for Retail Floor Space in Nowra CBD to 2036Store Type 2011 2016 2021 2026 2031 2036Supermarkets & Grocery Stores 14,363 16,066 17,848 19,597 21,284 22,959Specialty Food Stores 6,327 7,077 7,862 8,633 9,376 10,114Restaurants and Fast Foods 4,711 5,269 5,854 6,427 6,981 7,530Department Stores 16,238 18,078 20,003 21,907 23,745 25,563Clothing Stores 6,601 7,349 8,131 8,906 9,653 10,392Bulky Goods Stores 5,640 6,279 6,947 7,609 8,247 8,879Other Personal & Household Goods Retailing 17,757 19,794 21,923 24,027 26,055 28,065Selected Personal Services 3,519 3,936 4,372 4,801 5,214 5,624Total Retailing 75,154 83,848 92,941 101,907 110,555 119,126The above table shows that Nowra CBD requires around 75,000sqm of retail floor space to meet demand in 2011.8.4 Tourism ExpenditureIn addition to household expenditure, demand for retail services is also generated by visitors or tourists. The mainsource of data used to estimate tourism expenditure is the National Visitor Survey (NVS) conducted by TourismResearch Australia (TRA). TRA provides information on visitor characteristics to Local Government Areas locatedoutside capital city regions.In 2006-07 <strong>Shoalhaven</strong> had 1.08m overnight tourists and 1.16m day trippers (tourists beyond <strong>Shoalhaven</strong> LGA)spending around $470m. Around half of tourism spend relates to retail goods and services. Apportioning this spendbetween the centres is difficult. Much of it can be ascertained by the types of stores in those centres. Many centressuch as Berry and Huskisson rely considerably on tourism for their viability. Nowra’s role in relation to tourism on theother hand is more related to serving the regional or sub-regional shopping needs of surrounding residents. For Nowraa reasonable estimate is that 7% of its turnover is derived from tourists – from people who live outside the LGA. Thistranslates to around $32m or 14% of the LGA’s total capture. This expenditure supports a further 6,000sqm in the CBDin 2011 on top of the 75,000sqm demanded, increasing the undersupply to around 30,000sqm.C09143 Page 44 Hill PDA
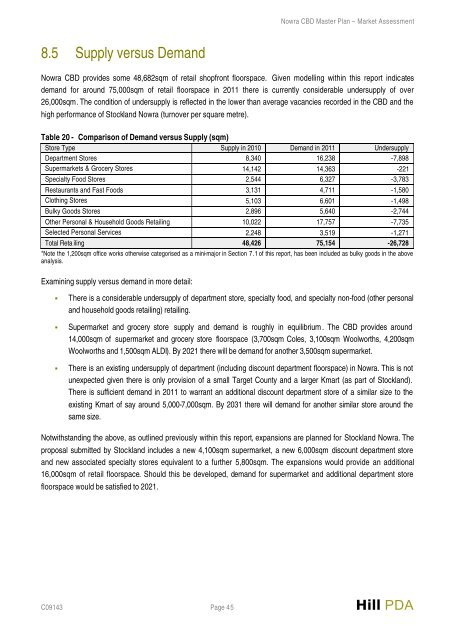
Nowra CBD Master Plan – <strong>Market</strong> <strong>Assessment</strong>8.5 Supply versus DemandNowra CBD provides some 48,682sqm of retail shopfront floorspace. Given modelling within this report indicatesdemand for around 75,000sqm of retail floorspace in 2011 there is currently considerable undersupply of over26,000sqm. The condition of undersupply is reflected in the lower than average vacancies recorded in the CBD and thehigh performance of Stockland Nowra (turnover per square metre).Table 20 - Comparison of Demand versus Supply (sqm)Store Type Supply in 2010 Demand in 2011 UndersupplyDepartment Stores 8,340 16,238 -7,898Supermarkets & Grocery Stores 14,142 14,363 -221Specialty Food Stores 2,544 6,327 -3,783Restaurants and Fast Foods 3,131 4,711 -1,580Clothing Stores 5,103 6,601 -1,498Bulky Goods Stores 2,896 5,640 -2,744Other Personal & Household Goods Retailing 10,022 17,757 -7,735Selected Personal Services 2,248 3,519 -1,271Total Reta iling 48,426 75,154 -26,728*Note the 1,200sqm office works otherwise categorised as a mini-major in Section 7.1 of this report, has been included as bulky goods in the aboveanalysis.Examining supply versus demand in more detail:• There is a considerable undersupply of department store, specialty food, and specialty non-food (other personaland household goods retailing) retailing.• Supermarket and grocery store supply and demand is roughly in equilibrium . The CBD provides around14,000sqm of supermarket and grocery store floorspace (3,700sqm Coles, 3,100sqm Woolworths, 4,200sqmWoolworths and 1,500sqm ALDI). By 2021 there will be demand for another 3,500sqm supermarket.• There is an existing undersupply of department (including discount department floorspace) in Nowra. This is notunexpected given there is only provision of a small Target County and a larger Kmart (as part of Stockland).There is sufficient demand in 2011 to warrant an additional discount department store of a similar size to theexisting Kmart of say around 5,000-7,000sqm. By 2031 there will demand for another similar store around thesame size.Notwithstanding the above, as outlined previously within this report, expansions are planned for Stockland Nowra. Theproposal submitted by Stockland includes a new 4,100sqm supermarket, a new 6,000sqm discount department storeand new associated specialty stores equivalent to a further 5,800sqm. The expansions would provide an additional16,000sqm of retail floorspace. Should this be developed, demand for supermarket and additional department storefloorspace would be satisfied to 2021.C09143 Page 45 Hill PDA