Background_E_Market_Assessment - Shoalhaven City Council ...
Background_E_Market_Assessment - Shoalhaven City Council ...
Background_E_Market_Assessment - Shoalhaven City Council ...

You also want an ePaper? Increase the reach of your titles
YUMPU automatically turns print PDFs into web optimized ePapers that Google loves.
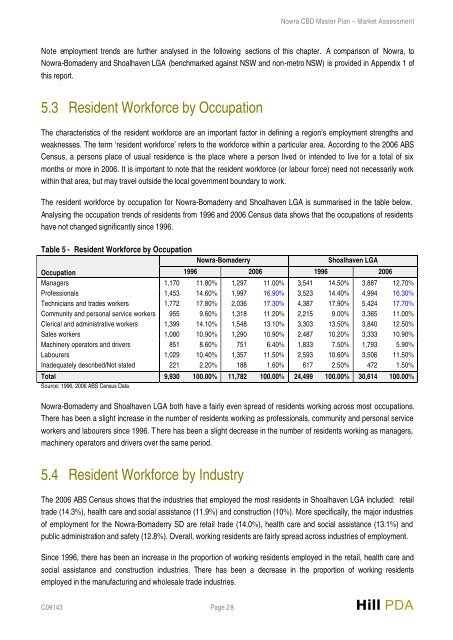
Nowra CBD Master Plan – <strong>Market</strong> <strong>Assessment</strong>Note employment trends are further analysed in the following sections of this chapter. A comparison of Nowra, toNowra-Bomaderry and <strong>Shoalhaven</strong> LGA (benchmarked against NSW and non-metro NSW) is provided in Appendix 1 ofthis report.5.3 Resident Workforce by OccupationThe characteristics of the resident workforce are an important factor in defining a region’s employment strengths andweaknesses. The term ‘resident workforce’ refers to the workforce within a particular area. According to the 2006 ABSCensus, a persons place of usual residence is the place where a person lived or intended to live for a total of sixmonths or more in 2006. It is important to note that the resident workforce (or labour force) need not necessarily workwithin that area, but may travel outside the local government boundary to work.The resident workforce by occupation for Nowra-Bomaderry and <strong>Shoalhaven</strong> LGA is summarised in the table below.Analysing the occupation trends of residents from 1996 and 2006 Census data shows that the occupations of residentshave not changed significantly since 1996.Table 5 - Resident Workforce by OccupationNowra-Bomaderry<strong>Shoalhaven</strong> LGAOccupation1996 2006 1996 2006Managers 1,170 11.80% 1,297 11.00% 3,541 14.50% 3,887 12.70%Professionals 1,453 14.60% 1,997 16.90% 3,523 14.40% 4,994 16.30%Technicians and trades workers 1,772 17.80% 2,036 17.30% 4,387 17.90% 5,424 17.70%Community and personal service workers 955 9.60% 1,318 11.20% 2,215 9.00% 3,365 11.00%Clerical and administrative workers 1,399 14.10% 1,548 13.10% 3,303 13.50% 3,840 12.50%Sales workers 1,080 10.90% 1,290 10.90% 2,487 10.20% 3,333 10.90%Machinery operators and drivers 851 8.60% 751 6.40% 1,833 7.50% 1,793 5.90%Labourers 1,029 10.40% 1,357 11.50% 2,593 10.60% 3,506 11.50%Inadequately described/Not stated 221 2.20% 188 1.60% 617 2.50% 472 1.50%Total 9,930 100.00% 11,782 100.00% 24,499 100.00% 30,614 100.00%Source: 1996, 2006 ABS Census DataNowra-Bomaderry and <strong>Shoalhaven</strong> LGA both have a fairly even spread of residents working across most occupations.There has been a slight increase in the number of residents working as professionals, community and personal serviceworkers and labourers since 1996. T here has been a slight decrease in the number of residents working as managers,machinery operators and drivers over the same period.5.4 Resident Workforce by IndustryThe 2006 ABS Census shows that the industries that employed the most residents in <strong>Shoalhaven</strong> LGA included: retailtrade (14.3%), health care and social assistance (11.9%) and construction (10%). More specifically, the major industriesof employment for the Nowra-Bomaderry SD are retail trade (14.0%), health care and social assistance (13.1%) andpublic administration and safety (12.8%). Overall, working residents are fairly spread across industries of employment.Since 1996, there has been an increase in the proportion of working residents employed in the retail, health care andsocial assistance and construction industries. There has been a decrease in the proportion of working residentsemployed in the manufacturing and wholesale trade industries.C09143 Page 28 Hill PDA