Background_E_Market_Assessment - Shoalhaven City Council ...
Background_E_Market_Assessment - Shoalhaven City Council ...
Background_E_Market_Assessment - Shoalhaven City Council ...

Create successful ePaper yourself
Turn your PDF publications into a flip-book with our unique Google optimized e-Paper software.
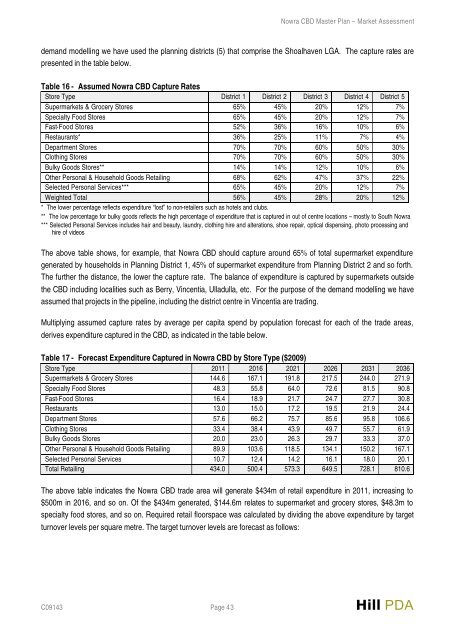
Nowra CBD Master Plan – <strong>Market</strong> <strong>Assessment</strong>demand modelling we have used the planning districts (5) that comprise the <strong>Shoalhaven</strong> LGA. The capture rates arepresented in the table below.Table 16 - Assumed Nowra CBD Capture RatesStore Type District 1 District 2 District 3 District 4 District 5Supermarkets & Grocery Stores 65% 45% 20% 12% 7%Specialty Food Stores 65% 45% 20% 12% 7%Fast-Food Stores 52% 36% 16% 10% 6%Restaurants* 36% 25% 11% 7% 4%Department Stores 70% 70% 60% 50% 30%Clothing Stores 70% 70% 60% 50% 30%Bulky Goods Stores** 14% 14% 12% 10% 6%Other Personal & Household Goods Retailing 68% 62% 47% 37% 22%Selected Personal Services*** 65% 45% 20% 12% 7%Weighted Total 56% 45% 28% 20% 12%* The lower percentage reflects expenditure “lost” to non-retailers such as hotels and clubs.** The low percentage for bulky goods reflects the high percentage of expenditure that is captured in out of centre locations – mostly to South Nowra*** Selected Personal Services includes hair and beauty, laundry, clothing hire and alterations, shoe repair, optical dispensing, photo processing andhire of videosThe above table shows, for example, that Nowra CBD should capture around 65% of total supermarket expendituregenerated by households in Planning District 1, 45% of supermarket expenditure from Planning District 2 and so forth.The further the distance, the lower the capture rate. The balance of expenditure is captured by supermarkets outsidethe CBD including localities such as Berry, Vincentia, Ulladulla, etc. For the purpose of the demand modelling we haveassumed that projects in the pipeline, including the district centre in Vincentia are trading.Multiplying assumed capture rates by average per capita spend by population forecast for each of the trade areas,derives expenditure captured in the CBD, as indicated in the table below.Table 17 - Forecast Expenditure Captured in Nowra CBD by Store Type ($2009)Store Type 2011 2016 2021 2026 2031 2036Supermarkets & Grocery Stores 144.6 167.1 191.8 217.5 244.0 271.9Specialty Food Stores 48.3 55.8 64.0 72.6 81.5 90.8Fast-Food Stores 16.4 18.9 21.7 24.7 27.7 30.8Restaurants 13.0 15.0 17.2 19.5 21.9 24.4Department Stores 57.6 66.2 75.7 85.6 95.8 106.6Clothing Stores 33.4 38.4 43.9 49.7 55.7 61.9Bulky Goods Stores 20.0 23.0 26.3 29.7 33.3 37.0Other Personal & Household Goods Retailing 89.9 103.6 118.5 134.1 150.2 167.1Selected Personal Services 10.7 12.4 14.2 16.1 18.0 20.1Total Retailing 434.0 500.4 573.3 649.5 728.1 810.6The above table indicates the Nowra CBD trade area will generate $434m of retail expenditure in 2011, increasing to$500m in 2016, and so on. Of the $434m generated, $144.6m relates to supermarket and grocery stores, $48.3m tospecialty food stores, and so on. Required retail floorspace was calculated by dividing the above expenditure by targetturnover levels per square metre. The target turnover levels are forecast as follows:C09143 Page 43 Hill PDA