Download - qendra per arsim demokratik
Download - qendra per arsim demokratik
Download - qendra per arsim demokratik
You also want an ePaper? Increase the reach of your titles
YUMPU automatically turns print PDFs into web optimized ePapers that Google loves.
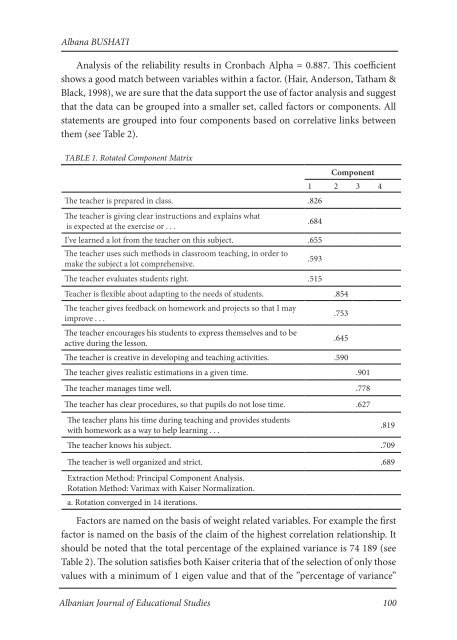
Albana BUSHATIAnalysis of the reliability results in Cronbach Alpha = 0.887. This coefficientshows a good match between variables within a factor. (Hair, Anderson, Tatham &Black, 1998), we are sure that the data support the use of factor analysis and suggestthat the data can be grouped into a smaller set, called factors or components. Allstatements are grouped into four components based on correlative links betweenthem (see Table 2).Table 1. Rotated Component MatrixComponent1 2 3 4The teacher is prepared in class. .826The teacher is giving clear instructions and explains whatis expected at the exercise or . . ..684I’ve learned a lot from the teacher on this subject. .655The teacher uses such methods in classroom teaching, in order tomake the subject a lot comprehensive..593The teacher evaluates students right. .515Teacher is flexible about adapting to the needs of students. .854The teacher gives feedback on homework and projects so that I mayimprove . . ..753The teacher encourages his students to express themselves and to beactive during the lesson..645The teacher is creative in developing and teaching activities. .590The teacher gives realistic estimations in a given time. .901The teacher manages time well. .778The teacher has clear procedures, so that pupils do not lose time. .627The teacher plans his time during teaching and provides studentswith homework as a way to help learning . . ..819The teacher knows his subject. .709The teacher is well organized and strict. .689Extraction Method: Principal Component Analysis.Rotation Method: Varimax with Kaiser Normalization.a. Rotation converged in 14 iterations.Factors are named on the basis of weight related variables. For example the firstfactor is named on the basis of the claim of the highest correlation relationship. Itshould be noted that the total <strong>per</strong>centage of the explained variance is 74 189 (seeTable 2). The solution satisfies both Kaiser criteria that of the selection of only thosevalues with a minimum of 1 eigen value and that of the ”<strong>per</strong>centage of variance”Albanian Journal of Educational Studies 100


