

Climate risks and adaptation in Asian coastal megacities: A synthesis
Climate risks and adaptation in Asian coastal megacities: A synthesis
Climate risks and adaptation in Asian coastal megacities: A synthesis
- No tags were found...

You also want an ePaper? Increase the reach of your titles
YUMPU automatically turns print PDFs into web optimized ePapers that Google loves.
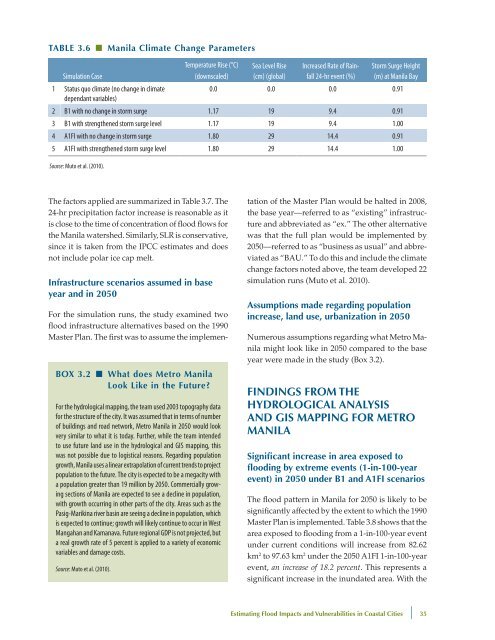
Table 3.6 ■ Manila <strong>Climate</strong> Change ParametersSimulation CaseTemperature Rise (°C)(downscaled)Sea Level Rise(cm) (global)Increased Rate of Ra<strong>in</strong>fall24-hr event (%)Storm Surge Height(m) at Manila Bay1 Status quo climate (no change <strong>in</strong> climate0.0 0.0 0.0 0.91dependant variables)2 B1 with no change <strong>in</strong> storm surge 1.17 19 9.4 0.913 B1 with strengthened storm surge level 1.17 19 9.4 1.004 A1FI with no change <strong>in</strong> storm surge 1.80 29 14.4 0.915 A1FI with strengthened storm surge level 1.80 29 14.4 1.00Source: Muto et al. (2010).The factors applied are summarized <strong>in</strong> Table 3.7. The24-hr precipitation factor <strong>in</strong>crease is reasonable as itis close to the time of concentration of flood flows forthe Manila watershed. Similarly, SLR is conservative,s<strong>in</strong>ce it is taken from the IPCC estimates <strong>and</strong> doesnot <strong>in</strong>clude polar ice cap melt.Infrastructure scenarios assumed <strong>in</strong> baseyear <strong>and</strong> <strong>in</strong> 2050Box 3.2 ■ What does Metro ManilaLook Like <strong>in</strong> the Future?For the hydrological mapp<strong>in</strong>g, the team used 2003 topography datafor the structure of the city. It was assumed that <strong>in</strong> terms of numberof build<strong>in</strong>gs <strong>and</strong> road network, Metro Manila <strong>in</strong> 2050 would lookvery similar to what it is today. Further, while the team <strong>in</strong>tendedto use future l<strong>and</strong> use <strong>in</strong> the hydrological <strong>and</strong> GIS mapp<strong>in</strong>g, thiswas not possible due to logistical reasons. Regard<strong>in</strong>g populationgrowth, Manila uses a l<strong>in</strong>ear extrapolation of current trends to projectpopulation to the future. The city is expected to be a megacity witha population greater than 19 million by 2050. Commercially grow<strong>in</strong>gsections of Manila are expected to see a decl<strong>in</strong>e <strong>in</strong> population,with growth occurr<strong>in</strong>g <strong>in</strong> other parts of the city. Areas such as thePasig-Marik<strong>in</strong>a river bas<strong>in</strong> are see<strong>in</strong>g a decl<strong>in</strong>e <strong>in</strong> population, whichis expected to cont<strong>in</strong>ue; growth will likely cont<strong>in</strong>ue to occur <strong>in</strong> WestMangahan <strong>and</strong> Kamanava. Future regional GDP is not projected, buta real growth rate of 5 percent is applied to a variety of economicvariables <strong>and</strong> damage costs.Source: Muto et al. (2010).For the simulation runs, the study exam<strong>in</strong>ed twoflood <strong>in</strong>frastructure alternatives based on the 1990Master Plan. The first was to assume the implementationof the Master Plan would be halted <strong>in</strong> 2008,the base year—referred to as “exist<strong>in</strong>g” <strong>in</strong>frastructure<strong>and</strong> abbreviated as “ex.” The other alternativewas that the full plan would be implemented by2050—referred to as “bus<strong>in</strong>ess as usual” <strong>and</strong> abbreviatedas “BAU.” To do this <strong>and</strong> <strong>in</strong>clude the climatechange factors noted above, the team developed 22simulation runs (Muto et al. 2010).Assumptions made regard<strong>in</strong>g population<strong>in</strong>crease, l<strong>and</strong> use, urbanization <strong>in</strong> 2050Numerous assumptions regard<strong>in</strong>g what Metro Manilamight look like <strong>in</strong> 2050 compared to the baseyear were made <strong>in</strong> the study (Box 3.2).F<strong>in</strong>d<strong>in</strong>gs from theHydrological Analysis<strong>and</strong> GIS Mapp<strong>in</strong>g for MetroManilaSignificant <strong>in</strong>crease <strong>in</strong> area exposed toflood<strong>in</strong>g by extreme events (1-<strong>in</strong>-100-yearevent) <strong>in</strong> 2050 under B1 <strong>and</strong> A1FI scenariosThe flood pattern <strong>in</strong> Manila for 2050 is likely to besignificantly affected by the extent to which the 1990Master Plan is implemented. Table 3.8 shows that thearea exposed to flood<strong>in</strong>g from a 1-<strong>in</strong>-100-year eventunder current conditions will <strong>in</strong>crease from 82.62km 2 to 97.63 km 2 under the 2050 A1FI 1-<strong>in</strong>-100-yearevent, an <strong>in</strong>crease of 18.2 percent. This represents asignificant <strong>in</strong>crease <strong>in</strong> the <strong>in</strong>undated area. With theEstimat<strong>in</strong>g Flood Impacts <strong>and</strong> Vulnerabilities <strong>in</strong> Coastal Cities | 35


