over the period of analysis. These assumptions aredescribed <strong>in</strong> chapter 2. Damages costs are evaluated<strong>in</strong> Thai Baht <strong>and</strong> converted to US dollars, us<strong>in</strong>g anaverage exchange rate for 2008 of 1 US$ = 33.31 THB.Bangkok likely to witness substantialdamage costs from flood<strong>in</strong>g <strong>in</strong> 2050, rang<strong>in</strong>gfrom $1.5 billion to $7 billion under a seriesof climate <strong>and</strong> l<strong>and</strong> use scenariosTable 4.2 presents the costs <strong>in</strong>curred from damagesto build<strong>in</strong>gs, <strong>in</strong>come losses, health costs, <strong>and</strong> revenuelosses to public utilities for a range of scenarios.A comparison across scenarios shows that the costsare likely to significantly <strong>in</strong>crease with climate <strong>and</strong>l<strong>and</strong> use change. In the base case scenario (2050-LS-T10), a 1-<strong>in</strong>-10-year flood is estimated to result<strong>in</strong> damages of 52 billion THB ($1.5 billion), but a1-<strong>in</strong>-100-year flood with climate change (2050-LS-SS-SR-A1FI) could cost THB 244 billion ($7 billion).The <strong>in</strong>crease <strong>in</strong> costs from flood<strong>in</strong>g are best illustratedby look<strong>in</strong>g at the implications of a mediumsizedflood. A 1-<strong>in</strong>-30-year flood <strong>in</strong> 2008 (2008-T30),for <strong>in</strong>stance, is estimated to result <strong>in</strong> damage costsof 35 billion THB ($1 billion). In 2050 with climatechange (2050-LS-SS-SR-A1FI-T30), a similar 1-<strong>in</strong>-30-year flood would cost 148 billion ($4.5 billion) 46 .Thus, <strong>in</strong> a future climate change (A1FI) scenario, a 1-<strong>in</strong>-30-year flood <strong>in</strong> 2050 could lead to a four-fold <strong>in</strong>crease<strong>in</strong> costs to Bangkok.To illustrate the nature of different costs associatedwith floods, Figure 4.1 breaks down the costsassociated with a 1-<strong>in</strong>-30-year flood <strong>in</strong> the future(2050-LS-SS-SR-A1FI). As the figure shows, thedirect costs to build<strong>in</strong>gs are the highest costs borneas a result of flood<strong>in</strong>g, followed by <strong>in</strong>come lossesto commercial establishments.It is useful to underst<strong>and</strong> more carefully therelationship between the costs of hazards such asfloods <strong>and</strong> the probability of their occurrence. Figure4.2 plots total damage costs to Bangkok fromfloods <strong>in</strong> different scenarios aga<strong>in</strong>st the probabilityof their occurrence. As this figure suggests, the costsof damage <strong>in</strong>crease for higher <strong>in</strong>tensity floods, butthis also means that there is a lower probability ofsuch floods occurr<strong>in</strong>g. The area beneath each floodexceedance curve represents the average total expectedflood damage cost from floods of differentFigure 4.1 ■ Damage Cost Associatedwith a 1-<strong>in</strong>-30-year Flood(C2050-LS-SR-SS-A1FI-T30)Damage costs (millions of THB)60,00050,00040,00030,00020,00010,000055,432Residence14045,945CommerceSource: Panya Consultants ( 2009).21,67112,3029,726IndustryIndirect ImpactPublic HealthDamage to Residencial Build<strong>in</strong>gDamage to Commercial Build<strong>in</strong>gDamage to Industrial Build<strong>in</strong>gIncome Loss of Daily Wage EarnerIncome Loss of CommerceIncome Loss of IndustryHealth Care CostIncome Loss of EnergyIncome Loss of Water Supply <strong>and</strong> SanitationTotal Damage Cost2,012 1,145 13EnergyDirect ImpactWater Supply& Sanitation55,432 MBaht45,94512,30214021,6719,7262,0121,14513148,386 MBaht<strong>in</strong>tensity <strong>in</strong> any one year. The difference <strong>in</strong> the areasbetween different exceedance curves representsthe <strong>in</strong>cremental annual damages as a result of a newclimate/l<strong>and</strong> use scenario. These annualized valuesare discussed later <strong>in</strong> the chapter.Figure 4.2 ■ Loss Exceedance Curves,BangkokDamage costs (mill THB)300,000250,000200,000150,000100,00050,00000.00 0.05 0.10 0.15Probability of flood ocurrence2008 2050-LS 2050-LS-SR-B12050-LS-SR-A1FI 2050-LS-SR-SS-A1FISource: Based on calculations <strong>in</strong> Panya Consultants (2009).461 USD=33.3133 THB, which was the average exchangerate <strong>in</strong> 2008.52 | <strong>Climate</strong> Risks <strong>and</strong> Adaptation <strong>in</strong> <strong>Asian</strong> Coastal Megacities: A Synthesis Report
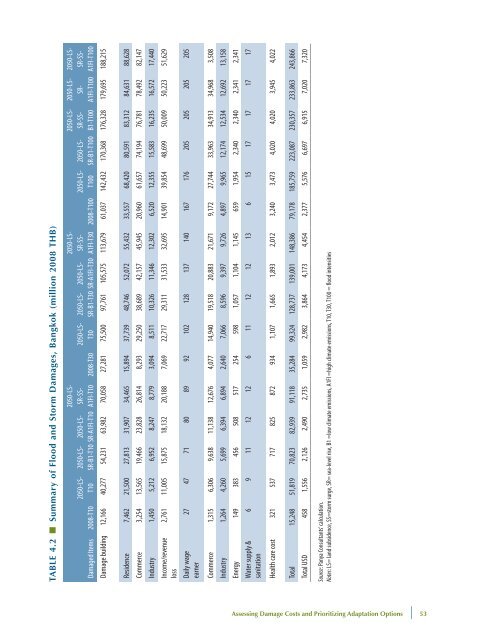
Table 4.2 ■ Summary of Flood <strong>and</strong> Storm Damages, Bangkok (million 2008 THB)Damaged Items 2008-T102050-LS-T102050-LS-SR-B1-T102050-LS-SR-A1FI-T102050-LS-SR-SS-A1FI-T10 2008-T302050-LS-T302050-LS-SR-B1-T302050-LS-SR-A1FI-T302050-LS-SR-SS-A1FI-T30 2008-T100Damage build<strong>in</strong>g 12,166 40,277 54,231 63,982 70,058 27,281 75,500 97,761 105,575 113,679 61,037 142,432 170,368 176,328 179,695 188,2152050-LS-T1002050-LS-SR-B1-T1002050-LS-SR-SS-B1-T1002050-LS-SR-A1FI-T1002050-LS-SR-SS-A1FI-T100Residence 7,462 21,500 27,813 31,907 34,465 15,894 37,739 48,746 52,072 55,432 33,557 68,420 80,591 83,312 84,631 88,628Commerce 3,254 13,565 19,466 23,828 26,814 8,293 29,250 38,689 42,157 45,945 20,960 61,657 74,194 76,781 78,492 82,147Industry 1,450 5,212 6,952 8,247 8,779 3,094 8,511 10,326 11,346 12,302 6,520 12,355 15,583 16,235 16,572 17,440Income/revenue 2,761 11,005 15,875 18,132 20,188 7,069 22,717 29,311 31,533 32,695 14,901 39,854 48,699 50,009 50,223 51,629lossDaily wageearner27 47 71 80 89 92 102 128 137 140 167 176 205 205 205 205Commerce 1,315 6,306 9,638 11,138 12,676 4,077 14,940 19,518 20,883 21,671 9,172 27,744 33,963 34,913 34,968 3,508Industry 1,264 4,260 5,699 6,394 6,894 2,640 7,066 8,596 9,397 9,726 4,897 9,965 12,174 12,534 12,692 13,158Energy 149 383 456 508 517 254 598 1,057 1,104 1,145 659 1,954 2,340 2,340 2,341 2,341Water supply &sanitation6 9 11 12 12 6 11 12 12 13 6 15 17 17 17 17Health care cost 321 537 717 825 872 934 1,107 1,665 1,893 2,012 3,240 3,473 4,020 4,020 3,945 4,022Total 15,248 51,819 70,823 82,939 91,118 35,284 99,324 128,737 139,001 148,386 79,178 185,759 223,087 230,357 233,863 243,866Total USD 458 1,556 2,126 2,490 2,735 1,059 2,982 3,864 4,173 4,454 2,377 5,576 6,697 6,915 7,020 7,320Source: Panya Consultants’ calculation.Notes: LS= l<strong>and</strong> subsidence, SS=storm surge, SR= sea-level rise, B1 =low climate emissions, A1FI =high climate emissions, T10, T30, T100 = flood <strong>in</strong>tensitiesAssess<strong>in</strong>g Damage Costs <strong>and</strong> Prioritiz<strong>in</strong>g Adaptation Options | 53