

Climate risks and adaptation in Asian coastal megacities: A synthesis
Climate risks and adaptation in Asian coastal megacities: A synthesis
Climate risks and adaptation in Asian coastal megacities: A synthesis
- No tags were found...

Create successful ePaper yourself
Turn your PDF publications into a flip-book with our unique Google optimized e-Paper software.
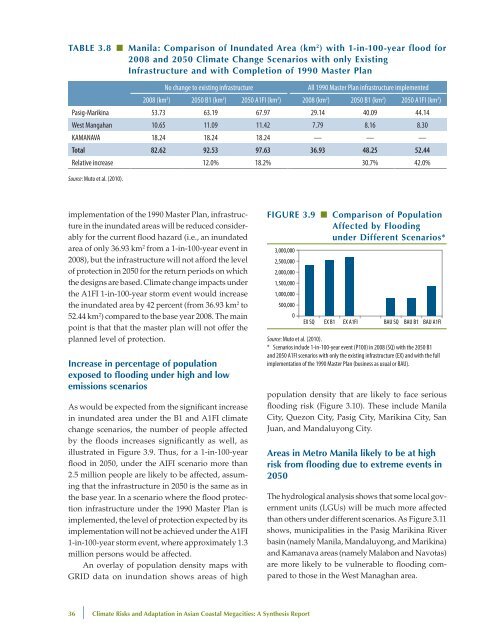
Table 3.8 ■ Manila: Comparison of Inundated Area (km 2 ) with 1-<strong>in</strong>-100-year flood for2008 <strong>and</strong> 2050 <strong>Climate</strong> Change Scenarios with only Exist<strong>in</strong>gInfrastructure <strong>and</strong> with Completion of 1990 Master PlanNo change to exist<strong>in</strong>g <strong>in</strong>frastructureAll 1990 Master Plan <strong>in</strong>frastructure implemented2008 (km 2 ) 2050 B1 (km 2 ) 2050 A1FI (km 2 ) 2008 (km 2 ) 2050 B1 (km 2 ) 2050 A1FI (km 2 )Pasig-Marik<strong>in</strong>a 53.73 63.19 67.97 29.14 40.09 44.14West Mangahan 10.65 11.09 11.42 7.79 8.16 8.30KAMANAVA 18.24 18.24 18.24 — — —Total 82.62 92.53 97.63 36.93 48.25 52.44Relative <strong>in</strong>crease 12.0% 18.2% 30.7% 42.0%Source: Muto et al. (2010).implementation of the 1990 Master Plan, <strong>in</strong>frastructure<strong>in</strong> the <strong>in</strong>undated areas will be reduced considerablyfor the current flood hazard (i.e., an <strong>in</strong>undatedarea of only 36.93 km 2 from a 1-<strong>in</strong>-100-year event <strong>in</strong>2008), but the <strong>in</strong>frastructure will not afford the levelof protection <strong>in</strong> 2050 for the return periods on whichthe designs are based. <strong>Climate</strong> change impacts underthe A1FI 1-<strong>in</strong>-100-year storm event would <strong>in</strong>creasethe <strong>in</strong>undated area by 42 percent (from 36.93 km 2 to52.44 km 2 ) compared to the base year 2008. The ma<strong>in</strong>po<strong>in</strong>t is that that the master plan will not offer theplanned level of protection.Increase <strong>in</strong> percentage of populationexposed to flood<strong>in</strong>g under high <strong>and</strong> lowemissions scenariosAs would be expected from the significant <strong>in</strong>crease<strong>in</strong> <strong>in</strong>undated area under the B1 <strong>and</strong> A1FI climatechange scenarios, the number of people affectedby the floods <strong>in</strong>creases significantly as well, asillustrated <strong>in</strong> Figure 3.9. Thus, for a 1-<strong>in</strong>-100-yearflood <strong>in</strong> 2050, under the AIFI scenario more than2.5 million people are likely to be affected, assum<strong>in</strong>gthat the <strong>in</strong>frastructure <strong>in</strong> 2050 is the same as <strong>in</strong>the base year. In a scenario where the flood protection<strong>in</strong>frastructure under the 1990 Master Plan isimplemented, the level of protection expected by itsimplementation will not be achieved under the A1FI1-<strong>in</strong>-100-year storm event, where approximately 1.3million persons would be affected.An overlay of population density maps withGRID data on <strong>in</strong>undation shows areas of highFigure 3.9 ■ Comparison of PopulationAffected by Flood<strong>in</strong>gunder Different Scenarios*3,000,0002,500,0002,000,0001,500,0001,000,000500,0000EX SQ EX B1 EX A1FI BAU SQ BAU B1 BAU A1FISource: Muto et al. (2010).* Scenarios <strong>in</strong>clude 1-<strong>in</strong>-100-year event (P100) <strong>in</strong> 2008 (SQ) with the 2050 B1<strong>and</strong> 2050 A1FI scenarios with only the exist<strong>in</strong>g <strong>in</strong>frastructure (EX) <strong>and</strong> with the fullimplementation of the 1990 Master Plan (bus<strong>in</strong>ess as usual or BAU).population density that are likely to face seriousflood<strong>in</strong>g risk (Figure 3.10). These <strong>in</strong>clude ManilaCity, Quezon City, Pasig City, Marik<strong>in</strong>a City, SanJuan, <strong>and</strong> M<strong>and</strong>aluyong City.Areas <strong>in</strong> Metro Manila likely to be at highrisk from flood<strong>in</strong>g due to extreme events <strong>in</strong>2050The hydrological analysis shows that some local governmentunits (LGUs) will be much more affectedthan others under different scenarios. As Figure 3.11shows, municipalities <strong>in</strong> the Pasig Marik<strong>in</strong>a Riverbas<strong>in</strong> (namely Manila, M<strong>and</strong>aluyong, <strong>and</strong> Marik<strong>in</strong>a)<strong>and</strong> Kamanava areas (namely Malabon <strong>and</strong> Navotas)are more likely to be vulnerable to flood<strong>in</strong>g comparedto those <strong>in</strong> the West Managhan area.36 | <strong>Climate</strong> Risks <strong>and</strong> Adaptation <strong>in</strong> <strong>Asian</strong> Coastal Megacities: A Synthesis Report


