

Climate risks and adaptation in Asian coastal megacities: A synthesis
Climate risks and adaptation in Asian coastal megacities: A synthesis
Climate risks and adaptation in Asian coastal megacities: A synthesis
- No tags were found...

You also want an ePaper? Increase the reach of your titles
YUMPU automatically turns print PDFs into web optimized ePapers that Google loves.
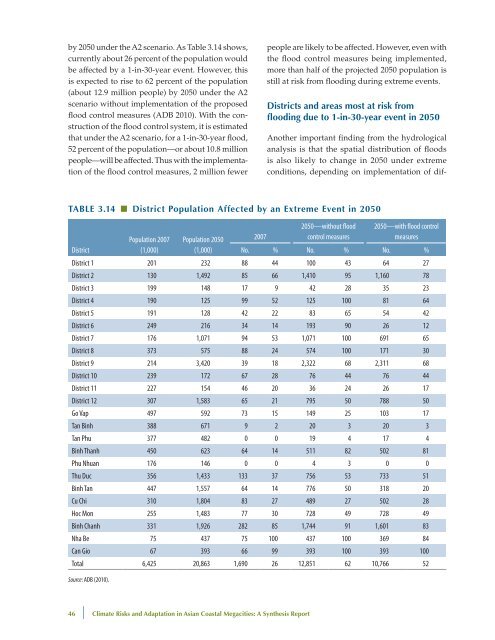
y 2050 under the A2 scenario. As Table 3.14 shows,currently about 26 percent of the population wouldbe affected by a 1-<strong>in</strong>-30-year event. However, thisis expected to rise to 62 percent of the population(about 12.9 million people) by 2050 under the A2scenario without implementation of the proposedflood control measures (ADB 2010). With the constructionof the flood control system, it is estimatedthat under the A2 scenario, for a 1-<strong>in</strong>-30-year flood,52 percent of the population—or about 10.8 millionpeople—will be affected. Thus with the implementationof the flood control measures, 2 million fewerpeople are likely to be affected. However, even withthe flood control measures be<strong>in</strong>g implemented,more than half of the projected 2050 population isstill at risk from flood<strong>in</strong>g dur<strong>in</strong>g extreme events.Districts <strong>and</strong> areas most at risk fromflood<strong>in</strong>g due to 1-<strong>in</strong>-30-year event <strong>in</strong> 2050Another important f<strong>in</strong>d<strong>in</strong>g from the hydrologicalanalysis is that the spatial distribution of floodsis also likely to change <strong>in</strong> 2050 under extremeconditions, depend<strong>in</strong>g on implementation of dif-Table 3.14 ■ District Population Affected by an Extreme Event <strong>in</strong> 2050Population 2007 Population 205020072050—without floodcontrol measures2050—with flood controlmeasuresDistrict(1,000)(1,000)No. % No. % No. %District 1 201 232 88 44 100 43 64 27District 2 130 1,492 85 66 1,410 95 1,160 78District 3 199 148 17 9 42 28 35 23District 4 190 125 99 52 125 100 81 64District 5 191 128 42 22 83 65 54 42District 6 249 216 34 14 193 90 26 12District 7 176 1,071 94 53 1,071 100 691 65District 8 373 575 88 24 574 100 171 30District 9 214 3,420 39 18 2,322 68 2,311 68District 10 239 172 67 28 76 44 76 44District 11 227 154 46 20 36 24 26 17District 12 307 1,583 65 21 795 50 788 50Go Vap 497 592 73 15 149 25 103 17Tan B<strong>in</strong>h 388 671 9 2 20 3 20 3Tan Phu 377 482 0 0 19 4 17 4B<strong>in</strong>h Thanh 450 623 64 14 511 82 502 81Phu Nhuan 176 146 0 0 4 3 0 0Thu Duc 356 1,433 133 37 756 53 733 51B<strong>in</strong>h Tan 447 1,557 64 14 776 50 318 20Cu Chi 310 1,804 83 27 489 27 502 28Hoc Mon 255 1,483 77 30 728 49 728 49B<strong>in</strong>h Chanh 331 1,926 282 85 1,744 91 1,601 83Nha Be 75 437 75 100 437 100 369 84Can Gio 67 393 66 99 393 100 393 100Total 6,425 20,863 1,690 26 12,851 62 10,766 52Source: ADB (2010).46 | <strong>Climate</strong> Risks <strong>and</strong> Adaptation <strong>in</strong> <strong>Asian</strong> Coastal Megacities: A Synthesis Report


