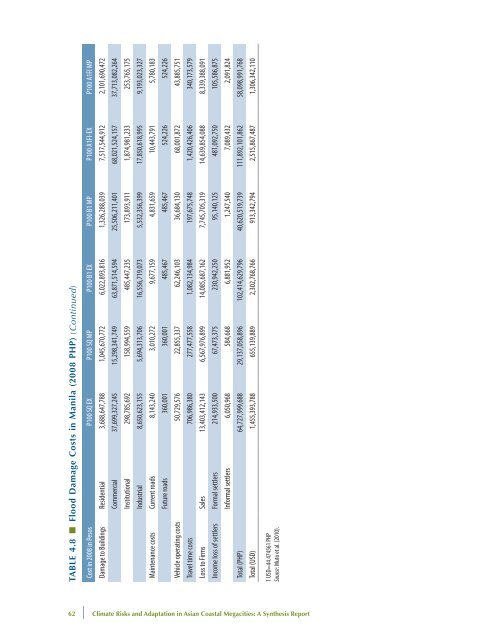
Table 4.8 ■ Flood Damage Costs <strong>in</strong> Manila (2008 PHP)(Cont<strong>in</strong>ued)Cost <strong>in</strong> 2008 <strong>in</strong> Pesos P100 SQ EX P100 SQ MP P100 B1 EX P100 B1 MP P100 A1FI-EX P100 A1FI MPDamage to Build<strong>in</strong>gs Residential 3,688,647,788 1,045,670,772 6,022,893,816 1,326,288,039 7,517,544,912 2,101,690,472Commercial 37,699,327,245 15,298,341,749 63,871,514,594 25,506,211,401 68,021,524,157 37,713,082,264Institutional 298,785,692 158,994,559 485,447,235 173,893,911 1,874,981,233 253,765,175Industrial 8,650,623,155 5,694,313,706 16,556,719,073 5,532,356,399 17,850,618,995 9,193,023,327Ma<strong>in</strong>tenance costs Current roads 8,143,240 3,010,272 9,677,159 4,831,659 10,443,791 5,780,183Future roads 360,001 360,001 485,467 485,467 524,226 524,226Vehicle operat<strong>in</strong>g costs 50,729,576 22,855,337 62,246,103 36,684,130 68,001,872 43,885,751Travel time costs 706,986,380 277,477,558 1,082,134,984 197,675,748 1,420,426,406 340,173,579Loss to Firms Sales 13,403,412,143 6,567,976,899 14,085,687,162 7,745,705,319 14,639,854,088 8,339,388,091Income loss of settlers Formal settlers 214,933,500 67,473,375 230,942,250 95,140,125 481,092,750 105,586,875Informal settlers 6,050,968 584,668 6,881,952 1,247,540 7,089,432 2,091,824Total (PHP) 64,727,999,688 29,137,058,896 102,414,629,796 40,620,519,739 111,892,101,862 58,098,991,768Total (USD) 1,455,393,788 655,139,889 2,302,768,766 913,342,794 2,515,867,487 1,306,342,1101 USD=44.474561 PHPSource: Muto et al. (2010).62 | <strong>Climate</strong> Risks <strong>and</strong> Adaptation <strong>in</strong> <strong>Asian</strong> Coastal Megacities: A Synthesis Report
Figure 4.5 ■ Loss Exceedance Curvesfor Manila (PHP)Damage costs120,000,000,000100,000,000,00080,000,000,00060,000,000,00040,000,000,00020,000,000,00000.00 0.02 0.04 0.06 0.08 0.10 0.12Probability of floodsSQ EX SQ MP B1 EX B1 MP A1FI EX A1FI MPSource: Based on estimations <strong>in</strong> Muto et al. (2010).as the probability of their occurrence decreases. Aspreviously discussed, the area beneath each curverepresents the average total annual expected damagecosts from floods of all <strong>in</strong>tensities (also see <strong>adaptation</strong>section). Note that the loss exceedance curve ishighest for the A1FI emissions scenario (A1FI-EX).<strong>Climate</strong> change <strong>in</strong>creases the extent of damages <strong>in</strong>all types of floods.Implement<strong>in</strong>g exist<strong>in</strong>g Master Plansrelated to <strong>in</strong>frastructure development willsignificantly reduce flood<strong>in</strong>g related costsFigure 4.6 ■ Damage Costs Associatedwith Different Scenarios(PHP)120,000,000,000100,000,000,00080,000,000,00060,000,000,00040,000,000,00020,000,000,0000SQ EX SQ MP B1 EX B1 MP A1FI EX A1FI MP1/10 1/30 1/100Source: Based on estimations <strong>in</strong> Muto et al. (2010).As Figure 4.6 shows, under each climate scenario,implement<strong>in</strong>g the master plan will result <strong>in</strong> a significantreduction <strong>in</strong> costs. In an A1FI climate changescenario, for example, a 1-<strong>in</strong>-30-year flood will result<strong>in</strong> damages to the extent of PHP 69 billion ($1.5 billion)without the master plan <strong>and</strong> PHP 19 billion($427 million) with the master plan implemented, soimplement<strong>in</strong>g the master plan would reduce flooddamages by over 70 percent, given climate change<strong>and</strong> the possibility of a 1-<strong>in</strong>-30-year flood. Thus, avery good start<strong>in</strong>g po<strong>in</strong>t for Manila, <strong>in</strong> terms of itsresponse to climate change, would be to reconsider<strong>and</strong> evaluate the master plans that are already onthe books.Build<strong>in</strong>g damages make up a major portionof flood-<strong>in</strong>duced costsThe s<strong>in</strong>gle most important contributor to totaldamage costs <strong>in</strong> each of the climate scenarios isdamage to build<strong>in</strong>gs. Approximately 72 percent ofthe costs from a 1-<strong>in</strong>-30-year flood (averaged acrossall scenarios), for <strong>in</strong>stance, result from damage tobuild<strong>in</strong>gs. Figure 4.7 shows the damage to build<strong>in</strong>gs<strong>in</strong> the case of a 1-<strong>in</strong>-30-year flood. The damagesare significant. Implement<strong>in</strong>g the master planwill reduce damages significantly. In the case of a1-<strong>in</strong>-30-year flood with an A1FI emissions scenario,implement<strong>in</strong>g the master plan will reduce damagesto build<strong>in</strong>gs by 74 percent (relative to A1FI-EX).Income losses from climate changeassociated floods will <strong>in</strong>crease by 9 to 16percentFloods will result <strong>in</strong> <strong>in</strong>come or revenue losses to<strong>in</strong>dividuals <strong>and</strong> firms. A 1-<strong>in</strong>-30-year flood withFigure 4.7 ■ Damages to Build<strong>in</strong>gsfrom a 1-<strong>in</strong>-30-year Flood(2008 PHP)60,000,000,00050,000,000,00040,000,000,00030,000,000,00020,000,000,00010,000,000,0000P30SQ EXP30SQ MPP30B1 EXSource: Based on estimations <strong>in</strong> Muto et al. (2010).P30B1 MPDamages to Build<strong>in</strong>gsP30A1FI EXP30A1FI MPAssess<strong>in</strong>g Damage Costs <strong>and</strong> Prioritiz<strong>in</strong>g Adaptation Options | 63