OneSteel Annual Report 2011Operational Overview CONTINUEDStrategic FrameworkScoreCARd14Delivering OneSteel’s strategyOneSteel aims to deliver superior and sustainable returns throughthe cycle as well as generate strong cash outcomes. Our strategy forachieving this includes improving returns from existing businessesthrough building organisational capability, a disciplined approach toperforming the fundamentals well, such as managing costs, cash,other assets and markets, and through growing and diversifyingearnings with a particular focus on leveraging areas of advantage.Below is a summary of how the company performed against ourobjectives in a year of mixed performances between our segmentsdue to the different strengths of their markets.The four key elements to OneSteel’s overall business strategy are:• Improving returns from existing businesses• Achieving strong cash generation• Growing and diversifying earnings, and• Building organisational capability.Despite OneSteel’s overall profit performance for the year beingadversely affected by the impact of a very challenging externalenvironment on the Australian steel businesses, the good performancesof the Iron Ore and Mining Consumables segments and the improvedperformance of the Recycling segment helped the company deliver avery solid cash outcome for the year.Shareholders are continuing to benefit from the company’sinvestment in Project Magnet with the Iron Ore segment delivering avery strong EBIT result of $524 million for the year, and a return onfunds employed of 70%.OneSteel is continuing to invest to grow its Iron Ore business and madegood progress with Project Magnet Phase 2 during the year, aimed atincreasing reserves and resources and maintaining sales at the rate of6 million tonnes per annum for at least 10 years. Approximately $60million in capital cash expenditure was spent during the financial yearon this project with investments including an ore beneficiation plant atIron Baron, additional mine cutbacks, exploration, infrastructure androads, expansion of the mining fleet and investments in new minesaimed at increasing capacity. We continue to do work to increase ourreserves and resources and whilst we only added a further 2.5 milliontonnes to reserves during the year, we have also identified a numberof promising opportunities during our exploration work that we expectwill further increase our reserves.In line with OneSteel’s long-term growth strategy of growing itsmining and mining consumables businesses, the company acquiredthe Moly-Cop Group during the year from Anglo American plc.The new business complements OneSteel’s existing expertise andcustomer relationships in grinding media and makes OneSteel thelargest manufacturer of grinding media globally. The acquisitionprovides OneSteel with leading positions in some of the world’smost attractive markets for mining consumables and increases thecompany’s diversification away from Australian construction andinfrastructure cycles.While OneSteel’s growth focus is on mining and mining consumables,the company remains focused on returning its Australian steelbusinesses to acceptable returns and continues to invest for thispurpose. During the fourth quarter, the company invested in repairand redesign work to the Whyalla blast furnace at a cost of $65million. As a result of this work the design life of the blast furnaceis expected to now extend beyond 2020. The impact of this workon the profit performance of the Manufacturing segment, includingassociated operational inefficiencies leading into the shut, weresignificant. OneSteel expects improved operational efficiency fromthe Whyalla blast furnace in the 2012 financial year.In response to the disappointing and unacceptable performanceof the Australian steel businesses during the year, OneSteel hascommenced further labour and other cost reductions,as well as a review of its steel product portfolio and facilities.Below is a summary of how the company performed against ourobjectives during the financial year ended 30 June 2011.Improving returns from existing businesses• Underlying EBIT increased 3% to $428 million• Iron Ore EBIT increased 57% to $524 million• Recycling EBIT increased 171% to $21 million• Australian Distribution underlying EBIT decreased to $10 million• Manufacturing underlying EBIT decreased to loss of $185 million• Sales margin decreased to 6.0% from 6.7%• Return on funds employed decreased slightly to 7.3% from 7.5%• Return on equity decreased slightly to 5.4% from 5.5%• Underlying earnings per share decreased to 17.7 cents from 18.2 cents.The Board declared a final dividend per share of 4 cents (unfranked).Total dividends per share decreased 10% to 10 cents (unfranked).Dividends for the 2011 financial year are unfranked as a result ofsignificant tax benefits received which reduced the balance offranking credits available. OneSteel’s ability to frank future dividendswill depend on the level of franking credits generated from tax paidin Australia in future financial years but is hopeful of returning tofranking in the 2012 financial year.Cash generation• Strong underlying operating cash flow $477 million• Underlying free cash flow $226 million• Statutory gearing (net debt/net debt plus equity) increased to27.7% from 17.7%, following the acquisition of the Moly-Cop Group• Improvements in working capital during the year despite theacquisition of the Moly-Cop Group.Growing and diversifying earnings• Revenue increased 15% to $7,133 million• Now over 40% of OneSteel’s revenue is sourced fromoutside Australia• Acquisition of the Moly-Cop Group during the year, OneSteel isnow the largest manufacturer of grinding media globally• Continued to make good progress in the Iron Ore business withProject Magnet Phase 2• Based on our current reserves and the beneficiation of low gradeore, the company expects to have sufficient iron ore for at least afurther 10 years at the rate of 6 million tonnes per annum• Iron ore sales expected to increase to approximately 9-10 milliontonnes per annum following announced port expansion at Whyallaand agreement to acquire WPG Resources’ iron ore assets• The company continues to focus on growth options in ourresource focused businesses.Organisational efficiency and capability• The company commenced further cost and labour reductionprograms during the year in response to the difficult marketconditions. This includes a review of our steel product portfolioand facilities• Staff have shown a high level of commitment and flexibility inresponding to the impact of the adverse external environmenton the company’s businesses, as well as in relation to the Whyallablast furnace interruption and repair work by working flexibly,taking leave and working reduced hours• Continued emphasis was placed on the targeted development ofstaff and business leaders, as well as the accelerated developmentof potential future business leaders to meet successionplanning needs• OneSteel continues to invest in talent pipelines and technicaltraining, employing approximately 250 apprentices, cadetsand graduates.
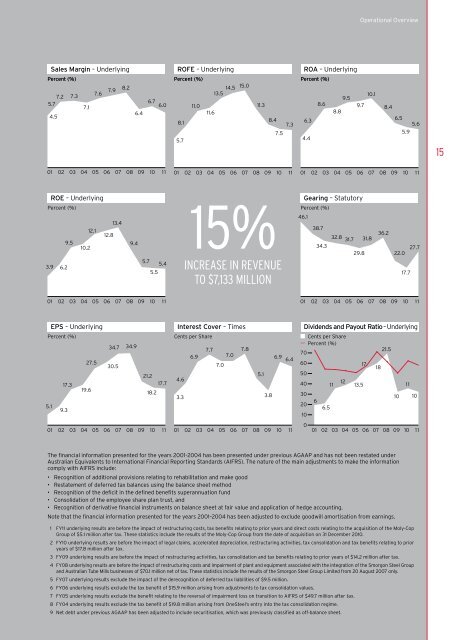
Operational OverviewSales Margin – UnderlyingPercent (%)ROFE – UnderlyingPercent (%)ROA – UnderlyingPercent (%)14.5 15.0 11.37.2 7.35.74.57.17.6 7.9 8.2 6.46.7 6.08.15.711.011.613.58.47.57.36.34.48.68.89.59.710.18.46.55.65.91501 02 03 04 05 06 07 08 09 10 1101 02 03 04 05 06 07 08 09 10 1101 02 03 04 05 06 07 08 09 10 11ROE – UnderlyingPercent (%)13.412.112.89.510.23.9 6.29.45.75.55.415%INCREASE IN RevenueTO $7,133 MillionGearing – StatutoryPercent (%)46.138.732.8 31.7 31.834.329.836.222.017.727.701 02 03 04 05 06 07 08 09 10 1101 02 03 04 05 06 07 08 09 10 11EPS – UnderlyingPercent (%)34.727.530.517.319.65.19.301 02 03 04 05 06 0734.921.218.217.7Interest Cover – TimesCents per Share4.63.36.97.77.07.07.85.13.86.9 6.4Dividends and Payout Ratio – UnderlyingCents per SharePercent (%)21.570008 09 10 11 01 02 03 04 05 06 07 08 09 10 11 01 02 03 04 05 06 07 08 09 10 1160504030201066.517181211 13.51110 10The financial information presented for the years 2001–2004 has been presented under previous AGAAP and has not been restated underAustralian Equivalents to International Financial Reporting Standards (AIFRS). The nature of the main adjustments to make the informationcomply with AIFRS include:• Recognition of additional provisions relating to rehabilitation and make good• Restatement of deferred tax balances using the balance sheet method• Recognition of the deficit in the defined benefits superannuation fund• Consolidation of the employee share plan trust, and• Recognition of derivative financial instruments on balance sheet at fair value and application of hedge accounting.Note that the financial information presented for the years 2001–2004 has been adjusted to exclude goodwill amortisation from earnings.1 FY11 underlying results are before the impact of restructuring costs, tax benefits relating to prior years and direct costs relating to the acquisition of the Moly-CopGroup of $5.1 million after tax. These statistics include the results of the Moly-Cop Group from the date of acquisition on 31 December 2010.2 FY10 underlying results are before the impact of legal claims, accelerated depreciation, restructuring activities, tax consolidation and tax benefits relating to prioryears of $17.8 million after tax.3 FY09 underlying results are before the impact of restructuring activities, tax consolidation and tax benefits relating to prior years of $14.2 million after tax.4 FY08 underlying results are before the impact of restructuring costs and impairment of plant and equipment associated with the integration of the Smorgon Steel Groupand Australian Tube Mills businesses of $70.1 million net of tax. These statistics include the results of the Smorgon Steel Group Limited from 20 August 2007 only.5 FY07 underlying results exclude the impact of the derecognition of deferred tax liabilities of $9.5 million.6 FY06 underlying results exclude the tax benefit of $15.9 million arising from adjustments to tax consolidation values.7 FY05 underlying results exclude the benefit relating to the reversal of impairment loss on transition to AIFRS of $49.7 million after tax.8 FY04 underlying results exclude the tax benefit of $19.8 million arising from OneSteel’s entry into the tax consolidation regime.9 Net debt under previous AGAAP has been adjusted to include securitisation, which was previously classified as off-balance sheet.