BROADENING OUR HORIZONS - Arrium
BROADENING OUR HORIZONS - Arrium
BROADENING OUR HORIZONS - Arrium
- No tags were found...

You also want an ePaper? Increase the reach of your titles
YUMPU automatically turns print PDFs into web optimized ePapers that Google loves.
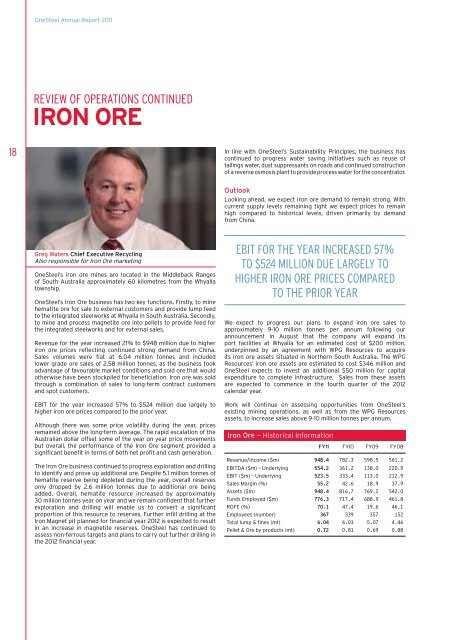
OneSteel Annual Report 2011REVIEW OF OPERATIONS CONTINUEDIRON ORE18In line with OneSteel’s Sustainability Principles, the business hascontinued to progress water saving initiatives such as reuse oftailings water, dust suppressants on roads and continued constructionof a reverse osmosis plant to provide process water for the concentrator.OutlookLooking ahead, we expect iron ore demand to remain strong. Withcurrent supply levels remaining tight we expect prices to remainhigh compared to historical levels, driven primarily by demandfrom China.Greg Waters Chief Executive RecyclingAlso responsible for Iron Ore marketingOneSteel’s iron ore mines are located in the Middleback Rangesof South Australia approximately 60 kilometres from the Whyallatownship.OneSteel’s Iron Ore business has two key functions. Firstly, to minehematite ore for sale to external customers and provide lump feedto the integrated steelworks at Whyalla in South Australia. Secondly,to mine and process magnetite ore into pellets to provide feed forthe integrated steelworks and for external sales.Revenue for the year increased 21% to $948 million due to higheriron ore prices reflecting continued strong demand from China.Sales volumes were flat at 6.04 million tonnes and includedlower grade ore sales of 2.58 million tonnes, as the business tookadvantage of favourable market conditions and sold ore that wouldotherwise have been stockpiled for beneficiation. Iron ore was soldthrough a combination of sales to long-term contract customersand spot customers.EBIT for the year increased 57% to $524 million due largely tohigher iron ore prices compared to the prior year.Although there was some price volatility during the year, pricesremained above the long-term average. The rapid escalation of theAustralian dollar offset some of the year on year price movementsbut overall, the performance of the Iron Ore segment provided asignificant benefit in terms of both net profit and cash generation.The Iron Ore business continued to progress exploration and drillingto identify and prove up additional ore. Despite 5.1 million tonnes ofhematite reserve being depleted during the year, overall reservesonly dropped by 2.6 million tonnes due to additional ore beingadded. Overall, hematite resource increased by approximately30 million tonnes year on year and we remain confident that furtherexploration and drilling will enable us to convert a significantproportion of this resource to reserves. Further infill drilling at theIron Magnet pit planned for financial year 2012 is expected to resultin an increase in magnetite reserves. OneSteel has continued toassess non-ferrous targets and plans to carry out further drilling inthe 2012 financial year.EBIT for the year increased 57%to $524 million due largely tohigher iron ore prices comparedto the prior yearWe expect to progress our plans to expand iron ore sales toapproximately 9-10 million tonnes per annum following ourannouncement in August that the company will expand itsport facilities at Whyalla for an estimated cost of $200 million,underpinned by an agreement with WPG Resources to acquireits iron ore assets situated in Northern South Australia. The WPGResources’ iron ore assets are estimated to cost $346 million andOneSteel expects to invest an additional $50 million for capitalexpenditure to complete infrastructure. Sales from these assetsare expected to commence in the fourth quarter of the 2012calendar year.Work will continue on assessing opportunities from OneSteel’sexisting mining operations, as well as from the WPG Resourcesassets, to increase sales above 9-10 million tonnes per annum.Iron Ore — Historical informationFY11 FY10 FY09 FY08Revenue/Income ($m) 948.4 782.3 598.5 561.2EBITDA ($m) – Underlying 554.2 361.2 138.0 220.9EBIT ($m) – Underlying 523.5 333.4 113.0 212.9Sales Margin (%) 55.2 42.6 18.9 37.9Assets ($m) 948.4 816.7 769.2 542.0Funds Employed ($m) 776.3 717.4 688.9 461.8ROFE (%) 70.1 47.4 19.6 46.1Employees (number) 367 339 357 152Total lump & fines (mt) 6.04 6.03 5.07 4.46Pellet & Ore by-products (mt) 0.72 0.81 0.69 0.88