Regulatory and policy options to encourage development of ...
Regulatory and policy options to encourage development of ...
Regulatory and policy options to encourage development of ...
- No tags were found...

You also want an ePaper? Increase the reach of your titles
YUMPU automatically turns print PDFs into web optimized ePapers that Google loves.
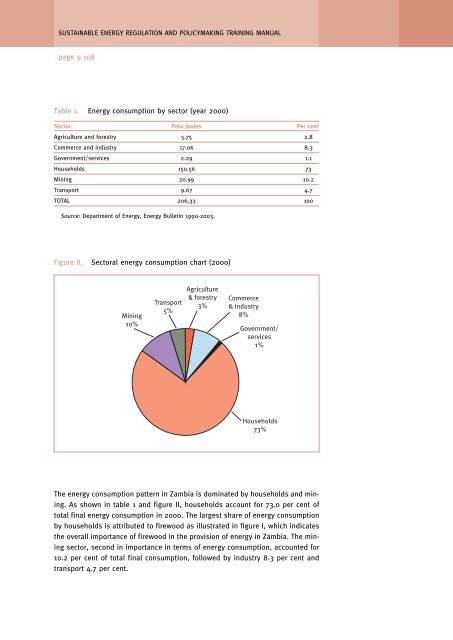
SUSTAINABLE ENERGY REGULATION AND POLICYMAKING TRAINING MANUALpage 9.108Table 1. Energy consumption by sec<strong>to</strong>r (year 2000)Sec<strong>to</strong>r Peta Joules Per centAgriculture <strong>and</strong> forestry 5.75 2.8Commerce <strong>and</strong> industry 17.06 8.3Government/services 2.29 1.1Households 150.56 73Mining 20.99 10.2Transport 9.67 4.7TOTAL 206.33 100Source: Department <strong>of</strong> Energy, Energy Bulletin 1990-2003.Figure II. Sec<strong>to</strong>ral energy consumption chart (2000)Mining10%Transport5%Agriculture& forestry3%Commerce& industry8%Government/services1%Households73%The energy consumption pattern in Zambia is dominated by households <strong>and</strong> mining.As shown in table 1 <strong>and</strong> figure II, households account for 73.0 per cent <strong>of</strong><strong>to</strong>tal final energy consumption in 2000. The largest share <strong>of</strong> energy consumptionby households is attributed <strong>to</strong> firewood as illustrated in figure I, which indicatesthe overall importance <strong>of</strong> firewood in the provision <strong>of</strong> energy in Zambia. The miningsec<strong>to</strong>r, second in importance in terms <strong>of</strong> energy consumption, accounted for10.2 per cent <strong>of</strong> <strong>to</strong>tal final consumption, followed by industry 8.3 per cent <strong>and</strong>transport 4.7 per cent.