FilmTec Technical Manual - Chester Paul Company
FilmTec Technical Manual - Chester Paul Company
FilmTec Technical Manual - Chester Paul Company

Create successful ePaper yourself
Turn your PDF publications into a flip-book with our unique Google optimized e-Paper software.
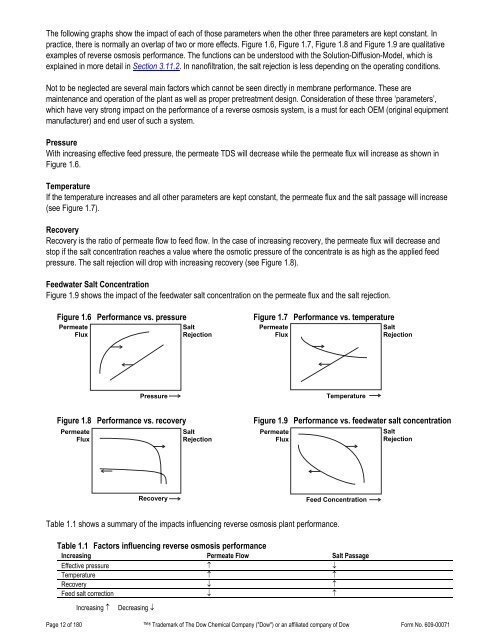
The following graphs show the impact of each of those parameters when the other three parameters are kept constant. Inpractice, there is normally an overlap of two or more effects. Figure 1.6, Figure 1.7, Figure 1.8 and Figure 1.9 are qualitativeexamples of reverse osmosis performance. The functions can be understood with the Solution-Diffusion-Model, which isexplained in more detail in Section 3.11.2. In nanofiltration, the salt rejection is less depending on the operating conditions.Not to be neglected are several main factors which cannot be seen directly in membrane performance. These aremaintenance and operation of the plant as well as proper pretreatment design. Consideration of these three ‘parameters’,which have very strong impact on the performance of a reverse osmosis system, is a must for each OEM (original equipmentmanufacturer) and end user of such a system.PressureWith increasing effective feed pressure, the permeate TDS will decrease while the permeate flux will increase as shown inFigure 1.6.TemperatureIf the temperature increases and all other parameters are kept constant, the permeate flux and the salt passage will increase(see Figure 1.7).RecoveryRecovery is the ratio of permeate flow to feed flow. In the case of increasing recovery, the permeate flux will decrease andstop if the salt concentration reaches a value where the osmotic pressure of the concentrate is as high as the applied feedpressure. The salt rejection will drop with increasing recovery (see Figure 1.8).Feedwater Salt ConcentrationFigure 1.9 shows the impact of the feedwater salt concentration on the permeate flux and the salt rejection.Figure 1.6 Performance vs. pressurePermeateFluxSaltRejectionFigure 1.7 Performance vs. temperaturePermeateFluxSaltRejectionPressureTemperatureFigure 1.8 Performance vs. recoveryPermeateFluxSaltRejectionFigure 1.9 Performance vs. feedwater salt concentrationPermeateFluxSaltRejectionRecoveryFeed ConcentrationTable 1.1 shows a summary of the impacts influencing reverse osmosis plant performance.Table 1.1 Factors influencing reverse osmosis performanceIncreasing Permeate Flow Salt PassageEffective pressure ↑ ↓Temperature ↑ ↑Recovery ↓ ↑Feed salt correction ↓ ↑Increasing ↑Decreasing ↓Page 12 of 180 ® Trademark of The Dow Chemical <strong>Company</strong> ("Dow") or an affiliated company of Dow Form No. 609-00071