- Page 2:
DESIGN AND DEVELOPMENTOF MEDICAL EL
- Page 8:
Copyright © 2005 by John Wiley & S
- Page 14:
CONTENTSPREFACEDISCLAIMERABOUT THE
- Page 20:
xPREFACEThe book addresses the prac
- Page 26:
DISCLAIMERThe projects in this book
- Page 30:
ABOUT THE AUTHORSDavid Prutchi is V
- Page 36:
2 BIOPOTENTIAL AMPLIFIERSGainG70.7%
- Page 40:
4 BIOPOTENTIAL AMPLIFIERSVolumeCond
- Page 44:
6 BIOPOTENTIAL AMPLIFIERSWarning! T
- Page 48:
8 BIOPOTENTIAL AMPLIFIERSIfRf-VccRi
- Page 52:
10 BIOPOTENTIAL AMPLIFIERSFigure 1.
- Page 56:
12 BIOPOTENTIAL AMPLIFIERSof the sk
- Page 60:
14 BIOPOTENTIAL AMPLIFIERScontamina
- Page 64:
16 BIOPOTENTIAL AMPLIFIERSFigure 1.
- Page 68:
18 BIOPOTENTIAL AMPLIFIERSFigure 1.
- Page 72:
20 BIOPOTENTIAL AMPLIFIERSA way of
- Page 76:
22 BIOPOTENTIAL AMPLIFIERSskin- ele
- Page 80:
24 BIOPOTENTIAL AMPLIFIERSFigure 1.
- Page 84:
26 BIOPOTENTIAL AMPLIFIERSOscillosc
- Page 88:
28 BIOPOTENTIAL AMPLIFIERS+15VV 132
- Page 92:
X1KX100X10JP2Sense3 2 13 2 14 5 6JP
- Page 96:
32 BIOPOTENTIAL AMPLIFIERSgenerator
- Page 100:
34 BIOPOTENTIAL AMPLIFIERSFigure 1.
- Page 104:
36 BIOPOTENTIAL AMPLIFIERSresults i
- Page 108:
38 BIOPOTENTIAL AMPLIFIERSUsing off
- Page 112:
40 BIOPOTENTIAL AMPLIFIERSFigure 1.
- Page 116:
42 BANDPASS SELECTION FOR BIOPOTENT
- Page 120:
44 BANDPASS SELECTION FOR BIOPOTENT
- Page 124:
46 BANDPASS SELECTION FOR BIOPOTENT
- Page 128:
48 BANDPASS SELECTION FOR BIOPOTENT
- Page 132:
50 BANDPASS SELECTION FOR BIOPOTENT
- Page 136:
52 BANDPASS SELECTION FOR BIOPOTENT
- Page 140:
54 BANDPASS SELECTION FOR BIOPOTENT
- Page 144:
56 BANDPASS SELECTION FOR BIOPOTENT
- Page 148:
5V_ISOIR25.1MR35.1MIR11M2374 8-+65V
- Page 152:
60 BANDPASS SELECTION FOR BIOPOTENT
- Page 156:
62Figure 2.14 State-variable filter
- Page 160:
64Figure 2.16 Since the cutoff freq
- Page 164:
66Figure 2.17 PSpice simulation res
- Page 168:
68 BANDPASS SELECTION FOR BIOPOTENT
- Page 172:
70 BANDPASS SELECTION FOR BIOPOTENT
- Page 176:
OUTOutputOut GND6R42kIC 1UAF42 8Hig
- Page 180:
-OUTOUTGNDININPUTINGND11R5100k1213+
- Page 184:
76 BANDPASS SELECTION FOR BIOPOTENT
- Page 188:
78 BANDPASS SELECTION FOR BIOPOTENT
- Page 192:
80 BANDPASS SELECTION FOR BIOPOTENT
- Page 196:
82 BANDPASS SELECTION FOR BIOPOTENT
- Page 200:
84 BANDPASS SELECTION FOR BIOPOTENT
- Page 204:
86Figure 2.35 The slew-rate limiter
- Page 208:
88 BANDPASS SELECTION FOR BIOPOTENT
- Page 212:
J3OUTPUTBNC2CR81.05KIC 2C406654 3LP
- Page 216:
IC5DCD4093B11CDisplay_InAD131N41484
- Page 220:
OUT+5V_ISOC122uF3284+-IC1A1OPA2130+
- Page 226:
3DESIGN OF SAFE MEDICALDEVICE PROTO
- Page 230:
STANDARDS FOR PROTECTION AGAINST EL
- Page 234:
LEAKAGE CURRENTS 1011. Ground leaka
- Page 238:
Figure 3.2 A universal differential
- Page 242:
DESIGN EXAMPLE: ISOLATED DIFFERENTI
- Page 246:
-15VC6+15VC5.01uFIC2.01uF UA741 -15
- Page 250:
ANALOG SIGNAL ISOLATION USING OPTIC
- Page 254:
LINEAR ANALOG ISOLATION USING OPTOI
- Page 258:
LINEAR ANALOG ISOLATION USING OPTOI
- Page 262:
NON ISO.POWERSignalOutputJP312ISO.P
- Page 266:
ISOLATEDPOWERINPUTJ4ISOLATED SIDENO
- Page 270:
DIGITAL ALTERNATIVE TO SIGNAL ISOLA
- Page 274:
SOFTWARE FOR THE ISOLATED A/D 121LP
- Page 278:
POWER SUPPLIES 123Figure 3.17 The n
- Page 282:
ADDITIONAL PROTECTION 125In additio
- Page 286:
TESTING FOR COMPLIANCE 127designed
- Page 290:
TESTING FOR COMPLIANCE 129Voltage-M
- Page 294:
TESTING FOR COMPLIANCE 131The frequ
- Page 298:
SelectorSelectorPatientConnectionsP
- Page 302: +V_LCD-V_LCDC110.01uFR1462kR1362kC6
- Page 306: ISOLATED 125 VACAC BALANCE125VAC TO
- Page 310: TABLE 3.3 Normal and Fault Conditio
- Page 314: TESTING FOR COMPLIANCE 141TABLE 3.4
- Page 318: TESTING FOR COMPLIANCE 143HI-POTHV
- Page 322: TESTING FOR COMPLIANCE 145that diel
- Page 326: 4ELECTROMAGNETIC COMPATIBILITYAND M
- Page 330: RADIATED EMISSIONS FROM DIGITAL CIR
- Page 334: RADIATED EMISSIONS FROM DIGITAL CIR
- Page 338: +24VISOC6100nFIsoC12100nFIso15IC1+V
- Page 342: ELECTROMAGNETIC FIELDS 155TABLE 4.3
- Page 346: ELECTROMAGNETIC FIELDS 157andIlH(A/
- Page 350: PROBING E- AND H-FIELDS IN THE NEAR
- Page 356: 162 ELECTROMAGNETIC COMPATIBILITY A
- Page 360: 164Figure 4.11 The intermediate-fre
- Page 364: 166 ELECTROMAGNETIC COMPATIBILITY A
- Page 368: 168 ELECTROMAGNETIC COMPATIBILITY A
- Page 372: Metal BoxHot(Black)L150uHC11.0uF 40
- Page 376: 172 ELECTROMAGNETIC COMPATIBILITY A
- Page 380: 174 ELECTROMAGNETIC COMPATIBILITY A
- Page 384: 176 ELECTROMAGNETIC COMPATIBILITY A
- Page 388: 178 ELECTROMAGNETIC COMPATIBILITY A
- Page 392: 180 ELECTROMAGNETIC COMPATIBILITY A
- Page 396: 182 ELECTROMAGNETIC COMPATIBILITY A
- Page 400: 184 ELECTROMAGNETIC COMPATIBILITY A
- Page 404:
186 ELECTROMAGNETIC COMPATIBILITY A
- Page 408:
188 ELECTROMAGNETIC COMPATIBILITY A
- Page 412:
190 ELECTROMAGNETIC COMPATIBILITY A
- Page 416:
192 ELECTROMAGNETIC COMPATIBILITY A
- Page 420:
194 ELECTROMAGNETIC COMPATIBILITY A
- Page 424:
196 ELECTROMAGNETIC COMPATIBILITY A
- Page 428:
198 ELECTROMAGNETIC COMPATIBILITY A
- Page 432:
200 ELECTROMAGNETIC COMPATIBILITY A
- Page 436:
202 ELECTROMAGNETIC COMPATIBILITY A
- Page 442:
5SIGNAL CONDITIONING, DATA ACQUISIT
- Page 446:
UNIVERSAL SENSOR INTERFACE 207Figur
- Page 450:
Figure 5.3 Schematic diagram of the
- Page 454:
UNIVERSAL SENSOR INTERFACE 211As co
- Page 458:
UNIVERSAL SENSOR INTERFACE 213dat
- Page 462:
UNIVERSAL SENSOR INTERFACE 215TABLE
- Page 466:
UNIVERSAL SENSOR INTERFACE 217For d
- Page 470:
UNIVERSAL SENSOR INTERFACE 219Figur
- Page 474:
UNIVERSAL SENSOR INTERFACE 22111421
- Page 478:
UNIVERSAL SENSOR INTERFACE 223TO J2
- Page 482:
SAMPLING RATE AND THE NYQUIST THEOR
- Page 486:
FREE DATA ACQUISITION CARD IN YOUR
- Page 490:
OUTOUTGNDTOSOUNDCARDR1C110kR21000.1
- Page 494:
FREE DATA ACQUISITION CARD IN YOUR
- Page 498:
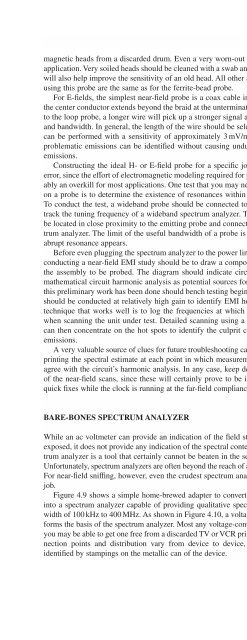
SPECTRAL ANALYSIS 233TABLE 5.4 Some
- Page 502:
SPECTRAL ANALYSIS 235In most instan
- Page 506:
w n x n e 2πjf n ∆t X( f ) ∆t
- Page 510:
SPECTRAL ANALYSIS 239High-Resolutio
- Page 514:
SPECTRAL ANALYSIS 241Figure 5.19 Po
- Page 518:
SPECTRAL ANALYSIS 243order, but an
- Page 522:
SPECTRAL ANALYSIS 245Figure 5.21 A
- Page 526:
REFERENCES 247apart over the biceps
- Page 532:
250 SIGNAL SOURCES FOR SIMULATION,
- Page 536:
252 SIGNAL SOURCES FOR SIMULATION,
- Page 540:
254 SIGNAL SOURCES FOR SIMULATION,
- Page 544:
256 SIGNAL SOURCES FOR SIMULATION,
- Page 548:
OUTPUTJ2SMBR10502WJP1JUMPER 3JP2JUM
- Page 552:
260 SIGNAL SOURCES FOR SIMULATION,
- Page 556:
262 SIGNAL SOURCES FOR SIMULATION,
- Page 560:
264 SIGNAL SOURCES FOR SIMULATION,
- Page 564:
266 SIGNAL SOURCES FOR SIMULATION,
- Page 568:
T112VAC 1AD11N4005D31N4005+ C45+220
- Page 572:
270 SIGNAL SOURCES FOR SIMULATION,
- Page 576:
272 SIGNAL SOURCES FOR SIMULATION,
- Page 580:
274 SIGNAL SOURCES FOR SIMULATION,
- Page 584:
276 SIGNAL SOURCES FOR SIMULATION,
- Page 588:
278 SIGNAL SOURCES FOR SIMULATION,
- Page 592:
280 SIGNAL SOURCES FOR SIMULATION,
- Page 596:
C791uFR112Z_SIG_OUTZ Amplitude~0-50
- Page 600:
284 SIGNAL SOURCES FOR SIMULATION,
- Page 604:
286 SIGNAL SOURCES FOR SIMULATION,
- Page 608:
288 SIGNAL SOURCES FOR SIMULATION,
- Page 612:
290 SIGNAL SOURCES FOR SIMULATION,
- Page 616:
292 SIGNAL SOURCES FOR SIMULATION,
- Page 620:
294Figure 6.31 A potentiostat-galva
- Page 624:
296 SIGNAL SOURCES FOR SIMULATION,
- Page 628:
298 SIGNAL SOURCES FOR SIMULATION,
- Page 632:
300 SIGNAL SOURCES FOR SIMULATION,
- Page 636:
302 SIGNAL SOURCES FOR SIMULATION,
- Page 642:
7STIMULATION OF EXCITABLE TISSUESAn
- Page 646:
STIMULATION OF EXCITABLE TISSUES 30
- Page 650:
EXTRACELLULAR STIMULATION 309membra
- Page 654:
CLINICAL USES OF ELECTRICAL STIMULA
- Page 658:
9. Control of Parkinsonian tremor.
- Page 662:
TABLE 7.1(Continued)CLINICAL USES O
- Page 666:
DIRECT STIMULATION OF NERVE AND MUS
- Page 670:
DIRECT STIMULATION OF NERVE AND MUS
- Page 674:
DIRECT STIMULATION OF NERVE AND MUS
- Page 678:
ELECTRODE 1ELECTRODE 2I_OUTR3+15V_S
- Page 682:
DIRECT STIMULATION OF NERVE AND MUS
- Page 686:
DIRECT STIMULATION OF NERVE AND MUS
- Page 690:
DIRECT STIMULATION OF NERVE AND MUS
- Page 694:
DIRECT STIMULATION OF NERVE AND MUS
- Page 698:
DIRECT STIMULATION OF NERVE AND MUS
- Page 702:
WAVEFORM:CLOSED = MONOPHASICOPEN =
- Page 706:
DIRECT STIMULATION OF NERVE AND MUS
- Page 710:
BT1 BT2 BT3 BT41.5V1.5V1.5V1.5VSW1P
- Page 714:
DIRECT STIMULATION OF NERVE AND MUS
- Page 718:
ELECTRODE 3BODY PARTTO BESTIMULATED
- Page 722:
• Cardiac demand pacemakers that
- Page 726:
MAGNETIC STIMULATION 347trast, a ma
- Page 730:
SCR1ST330S16P0L1COILEXTREME DANGER!
- Page 734:
MAGNETIC STIMULATION 351• TOFF: t
- Page 738:
MAGNETIC STIMULATION 353+ -d/dtCOIL
- Page 742:
MAGNETIC STIMULATION 355tube cap. A
- Page 746:
OTHER CLINICAL APPLICATIONS OF ELEC
- Page 750:
OTHER CLINICAL APPLICATIONS OF ELEC
- Page 754:
OTHER CLINICAL APPLICATIONS OF ELEC
- Page 758:
OTHER CLINICAL APPLICATIONS OF ELEC
- Page 762:
OTHER CLINICAL APPLICATIONS OF ELEC
- Page 766:
Hodgkin, A. L., and A. F. Huxley, A
- Page 770:
8CARDIAC PACING AND DEFIBRILLATIONW
- Page 774:
BRADYARRHYTHMIAS 371As a result, on
- Page 778:
THE FIRST PACEMAKERS 373designed in
- Page 782:
Figure 8.4 The output of a PSpice s
- Page 786:
THE FIRST PACEMAKERS 377V SenseA Se
- Page 790:
Pacing Mode This parameter selects
- Page 794:
EXTERNAL VVI PACEMAKER 381EXTERNAL
- Page 798:
Figure 8.11 presents the schematic
- Page 802:
VDDV+AnodeACTI VE_DISCHARGEQ1BSS84R
- Page 806:
EXTERNAL VVI PACEMAKER 387TimeStamp
- Page 810:
EXTERNAL VVI PACEMAKER 389}}default
- Page 814:
SOFTWARE TESTING 391Of course, safe
- Page 818:
IMPEDANCE TECHNIQUE 393contraction)
- Page 822:
IMPEDANCE TECHNIQUE 395
- Page 826:
IMPEDANCE TECHNIQUE 397C110.1uFR205
- Page 830:
DEMOD_OUT+15Viso-15VisoINPUTJ5SMC39
- Page 834:
INTRACARDIAC IMPEDANCE SENSOR 401Le
- Page 838:
INTRACARDIAC IMPEDANCE SENSOR 403At
- Page 842:
INTRACARDIAC IMPEDANCE SENSOR 405Fi
- Page 846:
VENTRICULAR TACHYARRHYTHMIAS 407Tim
- Page 850:
1.61.41.2Output Voltage10.80.60.4DV
- Page 854:
VENTRICULAR TACHYARRHYTHMIAS 411Imp
- Page 858:
DEFIBRILLATION 413stimulus waveform
- Page 862:
SW5Safety InterlockF12AF20.25ASW1Po
- Page 866:
SHOCK BOX PROTOTYPE 417defibrillati
- Page 870:
SHOCK BOX PROTOTYPE 419Figure 8.34
- Page 874:
Figure 8.36 Interconnection diagram
- Page 878:
SHOCK BOX PROTOTYPE 423In operation
- Page 882:
SHOCK BOX PROTOTYPE 425markets and
- Page 886:
Figure 8.40 A H-bridge switch confi
- Page 890:
SHOCK BOX PROTOTYPE 429V_CAP_OUTR56
- Page 894:
SHOCK BOX PROTOTYPE 431onboard the
- Page 898:
SHOCK BOX PROTOTYPE 433+12_VBATC791
- Page 902:
SHOCK BOX PROTOTYPE 435value by the
- Page 906:
CARDIAC FIBRILLATOR 4373. Every 1 s
- Page 910:
CONCLUDING REMARKS 439+9VS1R1IC15CO
- Page 914:
EPILOGUEOut of clutter, find simpli
- Page 918:
PATH THROUGH THE FDA 443intended us
- Page 922:
the industry is undergoing profound
- Page 926:
APPENDIX ASOURCES FOR MATERIALS AND
- Page 930:
SOURCES FOR MATERIALS AND COMPONENT
- Page 934:
APPENDIX BFTP SITE CONTENTftp://ftp
- Page 938:
FTP SITE CONTENT 453• LPT8FAST.BA
- Page 942:
FTP SITE CONTENT 455Folder: Redistr
- Page 948:
458 INDEXCentro de Construccion de
- Page 952:
460 INDEXPacemaker(s) (Continued)pu