Analysis of 2007 Emissions from Power Plants and Other ... - MARAMA
Analysis of 2007 Emissions from Power Plants and Other ... - MARAMA
Analysis of 2007 Emissions from Power Plants and Other ... - MARAMA

Create successful ePaper yourself
Turn your PDF publications into a flip-book with our unique Google optimized e-Paper software.
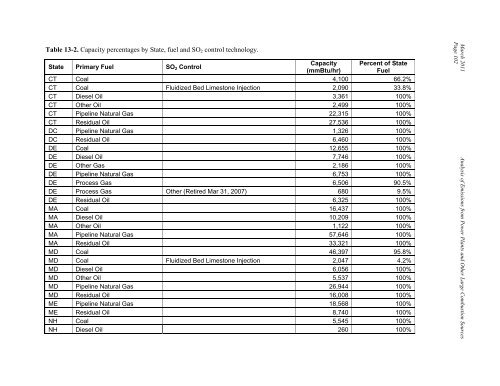
Table 13-2. Capacity percentages by State, fuel <strong>and</strong> SO 2 control technology.State Primary Fuel SO 2 ControlCapacity Percent <strong>of</strong> State(mmBtu/hr)FuelCT Coal 4,100 66.2%CT Coal Fluidized Bed Limestone Injection 2,090 33.8%CT Diesel Oil 3,361 100%CT <strong>Other</strong> Oil 2,499 100%CT Pipeline Natural Gas 22,315 100%CT Residual Oil 27,536 100%DC Pipeline Natural Gas 1,326 100%DC Residual Oil 6,460 100%DE Coal 12,655 100%DE Diesel Oil 7,746 100%DE <strong>Other</strong> Gas 2,186 100%DE Pipeline Natural Gas 6,753 100%DE Process Gas 6,506 90.5%DE Process Gas <strong>Other</strong> (Retired Mar 31, <strong>2007</strong>) 680 9.5%DE Residual Oil 6,325 100%MA Coal 16,437 100%MA Diesel Oil 10,209 100%MA <strong>Other</strong> Oil 1,122 100%MA Pipeline Natural Gas 57,646 100%MA Residual Oil 33,321 100%MD Coal 46,397 95.8%MD Coal Fluidized Bed Limestone Injection 2,047 4.2%MD Diesel Oil 6,056 100%MD <strong>Other</strong> Oil 5,537 100%MD Pipeline Natural Gas 26,944 100%MD Residual Oil 16,008 100%ME Pipeline Natural Gas 18,568 100%ME Residual Oil 8,740 100%NH Coal 5,545 100%NH Diesel Oil 260 100%March 2011 <strong>Analysis</strong> <strong>of</strong> <strong>Emissions</strong> <strong>from</strong> <strong>Power</strong> <strong>Plants</strong> <strong>and</strong> <strong>Other</strong> Large Combustion SourcesPage 102