Analysis of 2007 Emissions from Power Plants and Other ... - MARAMA
Analysis of 2007 Emissions from Power Plants and Other ... - MARAMA
Analysis of 2007 Emissions from Power Plants and Other ... - MARAMA
Create successful ePaper yourself
Turn your PDF publications into a flip-book with our unique Google optimized e-Paper software.
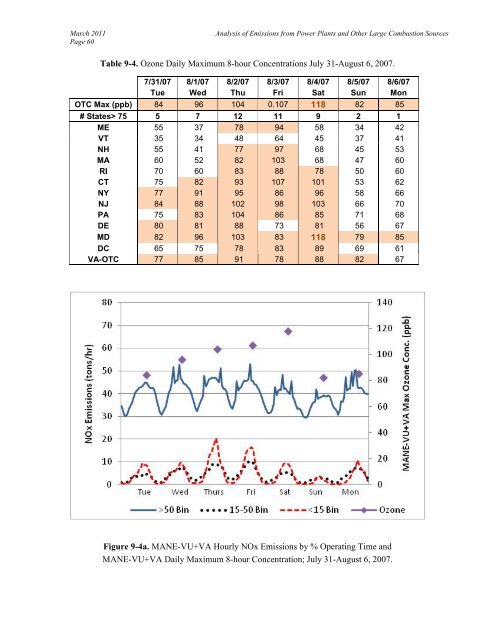
March 2011Page 60<strong>Analysis</strong> <strong>of</strong> <strong>Emissions</strong> <strong>from</strong> <strong>Power</strong> <strong>Plants</strong> <strong>and</strong> <strong>Other</strong> Large Combustion SourcesTable 9-4. Ozone Daily Maximum 8-hour Concentrations July 31-August 6, <strong>2007</strong>.7/31/07 8/1/07 8/2/07 8/3/07 8/4/07 8/5/07 8/6/07Tue Wed Thu Fri Sat Sun MonOTC Max (ppb) 84 96 104 0.107 118 82 85# States> 75 5 7 12 11 9 2 1ME 55 37 78 94 58 34 42VT 35 34 48 64 45 37 41NH 55 41 77 97 68 45 53MA 60 52 82 103 68 47 60RI 70 60 83 88 78 50 60CT 75 82 93 107 101 53 62NY 77 91 95 86 96 58 66NJ 84 88 102 98 103 66 70PA 75 83 104 86 85 71 68DE 80 81 88 73 81 56 67MD 82 96 103 83 118 79 85DC 65 75 78 83 89 69 61VA-OTC 77 85 91 78 88 82 67Figure 9-4a. MANE-VU+VA Hourly NOx <strong>Emissions</strong> by % Operating Time <strong>and</strong>MANE-VU+VA Daily Maximum 8-hour Concentration; July 31-August 6, <strong>2007</strong>.


