Analysis of 2007 Emissions from Power Plants and Other ... - MARAMA
Analysis of 2007 Emissions from Power Plants and Other ... - MARAMA
Analysis of 2007 Emissions from Power Plants and Other ... - MARAMA
You also want an ePaper? Increase the reach of your titles
YUMPU automatically turns print PDFs into web optimized ePapers that Google loves.
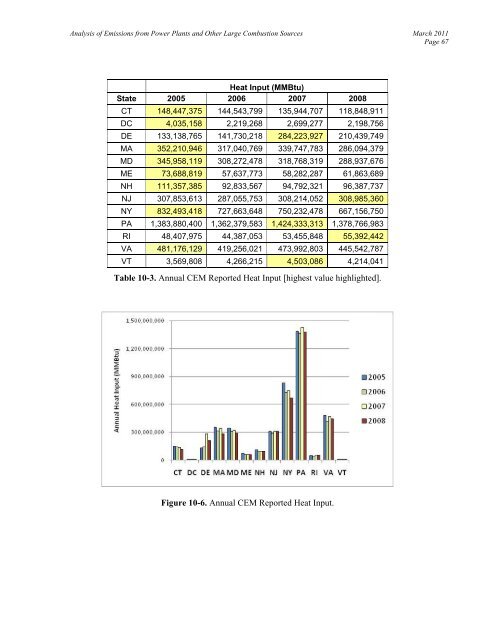
<strong>Analysis</strong> <strong>of</strong> <strong>Emissions</strong> <strong>from</strong> <strong>Power</strong> <strong>Plants</strong> <strong>and</strong> <strong>Other</strong> Large Combustion Sources March 2011Page 67Heat Input (MMBtu)State 2005 2006 <strong>2007</strong> 2008CT 148,447,375 144,543,799 135,944,707 118,848,911DC 4,035,158 2,219,268 2,699,277 2,198,756DE 133,138,765 141,730,218 284,223,927 210,439,749MA 352,210,946 317,040,769 339,747,783 286,094,379MD 345,958,119 308,272,478 318,768,319 288,937,676ME 73,688,819 57,637,773 58,282,287 61,863,689NH 111,357,385 92,833,567 94,792,321 96,387,737NJ 307,853,613 287,055,753 308,214,052 308,985,360NY 832,493,418 727,663,648 750,232,478 667,156,750PA 1,383,880,400 1,362,379,583 1,424,333,313 1,378,766,983RI 48,407,975 44,387,053 53,455,848 55,392,442VA 481,176,129 419,256,021 473,992,803 445,542,787VT 3,569,808 4,266,215 4,503,086 4,214,041Table 10-3. Annual CEM Reported Heat Input [highest value highlighted].Figure 10-6. Annual CEM Reported Heat Input.


