Analysis of 2007 Emissions from Power Plants and Other ... - MARAMA
Analysis of 2007 Emissions from Power Plants and Other ... - MARAMA
Analysis of 2007 Emissions from Power Plants and Other ... - MARAMA

You also want an ePaper? Increase the reach of your titles
YUMPU automatically turns print PDFs into web optimized ePapers that Google loves.
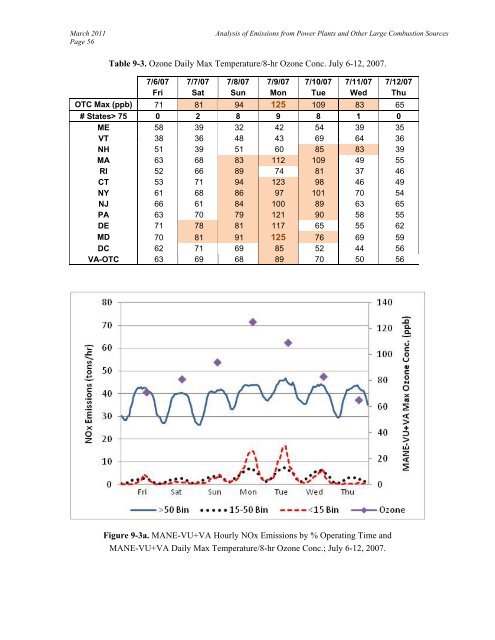
March 2011Page 56<strong>Analysis</strong> <strong>of</strong> <strong>Emissions</strong> <strong>from</strong> <strong>Power</strong> <strong>Plants</strong> <strong>and</strong> <strong>Other</strong> Large Combustion SourcesTable 9-3. Ozone Daily Max Temperature/8-hr Ozone Conc. July 6-12, <strong>2007</strong>.7/6/07 7/7/07 7/8/07 7/9/07 7/10/07 7/11/07 7/12/07Fri Sat Sun Mon Tue Wed ThuOTC Max (ppb) 71 81 94 125 109 83 65# States> 75 0 2 8 9 8 1 0ME 58 39 32 42 54 39 35VT 38 36 48 43 69 64 36NH 51 39 51 60 85 83 39MA 63 68 83 112 109 49 55RI 52 66 89 74 81 37 46CT 53 71 94 123 98 46 49NY 61 68 86 97 101 70 54NJ 66 61 84 100 89 63 65PA 63 70 79 121 90 58 55DE 71 78 81 117 65 55 62MD 70 81 91 125 76 69 59DC 62 71 69 85 52 44 56VA-OTC 63 69 68 89 70 50 56Figure 9-3a. MANE-VU+VA Hourly NOx <strong>Emissions</strong> by % Operating Time <strong>and</strong>MANE-VU+VA Daily Max Temperature/8-hr Ozone Conc.; July 6-12, <strong>2007</strong>.