Analysis of 2007 Emissions from Power Plants and Other ... - MARAMA
Analysis of 2007 Emissions from Power Plants and Other ... - MARAMA
Analysis of 2007 Emissions from Power Plants and Other ... - MARAMA

Create successful ePaper yourself
Turn your PDF publications into a flip-book with our unique Google optimized e-Paper software.
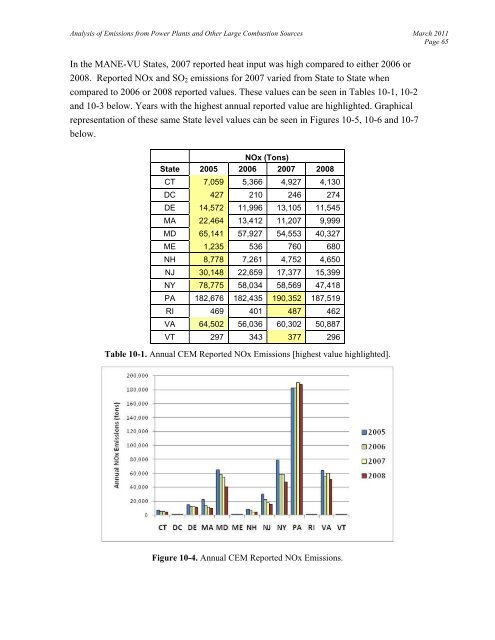
<strong>Analysis</strong> <strong>of</strong> <strong>Emissions</strong> <strong>from</strong> <strong>Power</strong> <strong>Plants</strong> <strong>and</strong> <strong>Other</strong> Large Combustion Sources March 2011Page 65In the MANE-VU States, <strong>2007</strong> reported heat input was high compared to either 2006 or2008. Reported NOx <strong>and</strong> SO 2 emissions for <strong>2007</strong> varied <strong>from</strong> State to State whencompared to 2006 or 2008 reported values. These values can be seen in Tables 10-1, 10-2<strong>and</strong> 10-3 below. Years with the highest annual reported value are highlighted. Graphicalrepresentation <strong>of</strong> these same State level values can be seen in Figures 10-5, 10-6 <strong>and</strong> 10-7below.NOx (Tons)State 2005 2006 <strong>2007</strong> 2008CT 7,059 5,366 4,927 4,130DC 427 210 246 274DE 14,572 11,996 13,105 11,545MA 22,464 13,412 11,207 9,999MD 65,141 57,927 54,553 40,327ME 1,235 536 760 680NH 8,778 7,261 4,752 4,650NJ 30,148 22,659 17,377 15,399NY 78,775 58,034 58,569 47,418PA 182,676 182,435 190,352 187,519RI 469 401 487 462VA 64,502 56,036 60,302 50,887VT 297 343 377 296Table 10-1. Annual CEM Reported NOx <strong>Emissions</strong> [highest value highlighted].Figure 10-4. Annual CEM Reported NOx <strong>Emissions</strong>.