Analysis of 2007 Emissions from Power Plants and Other ... - MARAMA
Analysis of 2007 Emissions from Power Plants and Other ... - MARAMA
Analysis of 2007 Emissions from Power Plants and Other ... - MARAMA

You also want an ePaper? Increase the reach of your titles
YUMPU automatically turns print PDFs into web optimized ePapers that Google loves.
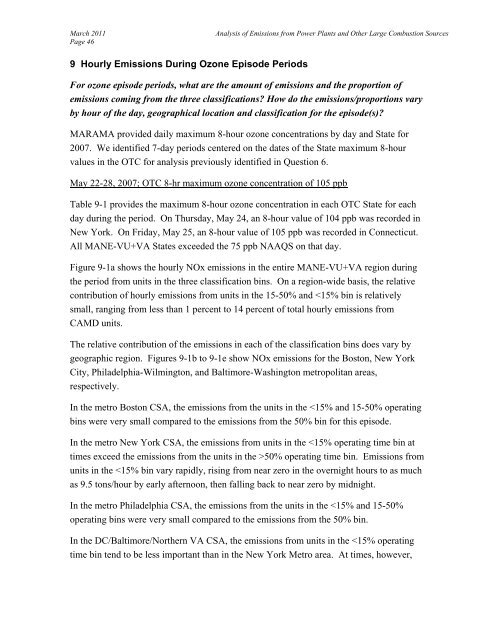
March 2011Page 46<strong>Analysis</strong> <strong>of</strong> <strong>Emissions</strong> <strong>from</strong> <strong>Power</strong> <strong>Plants</strong> <strong>and</strong> <strong>Other</strong> Large Combustion Sources9 Hourly <strong>Emissions</strong> During Ozone Episode PeriodsFor ozone episode periods, what are the amount <strong>of</strong> emissions <strong>and</strong> the proportion <strong>of</strong>emissions coming <strong>from</strong> the three classifications? How do the emissions/proportions varyby hour <strong>of</strong> the day, geographical location <strong>and</strong> classification for the episode(s)?<strong>MARAMA</strong> provided daily maximum 8-hour ozone concentrations by day <strong>and</strong> State for<strong>2007</strong>. We identified 7-day periods centered on the dates <strong>of</strong> the State maximum 8-hourvalues in the OTC for analysis previously identified in Question 6.May 22-28, <strong>2007</strong>; OTC 8-hr maximum ozone concentration <strong>of</strong> 105 ppbTable 9-1 provides the maximum 8-hour ozone concentration in each OTC State for eachday during the period. On Thursday, May 24, an 8-hour value <strong>of</strong> 104 ppb was recorded inNew York. On Friday, May 25, an 8-hour value <strong>of</strong> 105 ppb was recorded in Connecticut.All MANE-VU+VA States exceeded the 75 ppb NAAQS on that day.Figure 9-1a shows the hourly NOx emissions in the entire MANE-VU+VA region duringthe period <strong>from</strong> units in the three classification bins. On a region-wide basis, the relativecontribution <strong>of</strong> hourly emissions <strong>from</strong> units in the 15-50% <strong>and</strong>